US Airways 2008 Annual Report Download - page 84
Download and view the complete annual report
Please find page 84 of the 2008 US Airways annual report below. You can navigate through the pages in the report by either clicking on the pages listed below, or by using the keyword search tool below to find specific information within the annual report.-
 1
1 -
2
-
3
-
4
-
5
-
6
-
7
-
8
-
9
-
10
-
11
-
12
-
13
-
14
-
15
-
16
-
17
-
18
-
19
-
20
-
21
-
22
-
23
-
24
-
25
-
26
-
27
-
28
-
29
-
30
-
31
-
32
-
33
-
34
-
35
-
36
-
37
-
38
-
39
-
40
-
41
-
42
-
43
-
44
-
45
-
46
-
47
-
48
-
49
-
50
-
51
-
52
-
53
-
54
-
55
-
56
-
57
-
58
-
59
-
60
-
61
-
62
-
63
-
64
-
65
-
66
-
67
-
68
-
69
-
70
-
71
-
72
-
73
-
 74
74 -
 75
75 -
 76
76 -
 77
77 -
 78
78 -
 79
79 -
 80
80 -
 81
81 -
 82
82 -
 83
83 -
 84
84 -
 85
85 -
 86
86 -
 87
87 -
 88
88 -
 89
89 -
 90
90 -
 91
91 -
 92
92 -
 93
93 -
 94
94 -
95
-
96
-
97
-
98
-
99
-
100
-
101
-
102
-
103
-
104
-
105
-
106
-
107
-
108
-
109
-
110
-
111
-
112
-
113
-
114
-
115
-
116
-
117
-
118
-
119
-
120
-
121
-
122
-
123
-
124
-
125
-
126
-
127
-
128
-
129
-
130
-
131
-
132
-
133
-
134
-
135
-
136
-
137
-
138
-
139
-
140
-
141
-
142
-
143
-
144
-
145
-
146
-
147
-
148
-
149
-
150
-
151
-
152
-
153
-
154
-
155
-
156
-
157
-
158
-
159
-
160
-
161
-
162
-
163
-
164
-
165
-
166
-
167
-
168
-
169
-
170
-
171
-
172
-
173
-
174
-
175
-
176
-
177
-
178
-
179
-
180
-
181
-
182
-
183
-
184
-
185
-
186
-
187
-
188
-
189
-
190
-
191
-
192
-
193
-
194
-
195
-
196
-
197
-
198
-
199
-
200
-
201
-
202
-
203
-
204
-
205
-
206
-
207
-
208
-
209
-
210
-
211
-
212
-
213
-
214
-
215
-
216
-
217
-
218
-
219
-
220
-
221
-
222
-
223
-
224
-
225
-
226
-
227
-
228
-
229
-
230
-
231
-
232
-
233
-
234
-
235
-
236
-
237
-
238
-
239
-
240
-
241
-
242
-
243
-
244
-
245
-
246
-
247
-
248
-
249
-
250
-
251
-
252
-
253
-
254
-
255
-
256
-
257
-
258
-
259
-
260
-
261
-
262
-
263
-
264
-
265
-
266
-
267
-
268
-
269
-
270
-
271
-
272
-
273
-
274
-
275
-
276
-
277
-
278
-
279
-
280
-
281
-
282
-
283
-
284
-
285
-
286
-
287
-
288
-
289
-
290
-
291
-
292
-
293
-
294
-
295
-
296
-
297
-
298
-
299
-
300
-
301
-
302
-
303
-
304
-
305
-
306
-
307
-
308
-
309
-
310
-
311
-
312
-
313
-
314
-
315
-
316
-
317
-
318
-
319
-
320
-
321
-
322
-
323
-
324
-
325
-
326
-
327
-
328
-
329
-
330
-
331
-
332
-
333
-
334
-
335
-
336
-
337
-
338
-
339
-
340
-
341
-
342
-
343
-
344
-
345
-
346
-
347
-
348
-
349
-
350
-
351
-
352
-
353
-
354
-
355
-
356
-
357
-
358
-
359
-
360
-
361
-
362
-
363
-
364
-
365
-
366
-
367
-
368
-
369
-
370
-
371
-
372
-
373
-
374
-
375
-
376
-
377
-
378
-
379
-
380
-
381
-
382
-
383
-
384
-
385
-
386
-
387
-
388
-
389
-
390
-
391
-
392
-
393
-
394
-
395
-
396
-
397
-
398
-
399
-
400
-
401
 |
 |

Table of Contents
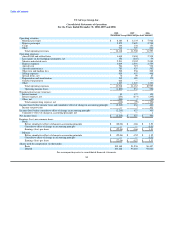
US Airways Group, Inc.
Consolidated Statements of Cash Flows
For the Years Ended December 31, 2008, 2007 and 2006
2008 2007 2006
(In millions)
Cash flows from operating activities:
Net income (loss) $ (2,210) $ 427 $ 304
Adjustments to reconcile net income (loss) to net cash provided by (used in) operating activities:
Cumulative effect of change in accounting principle — — (1)
Depreciation and amortization 240 212 198
Gain on curtailment of pension benefit — (5) —
Loss on dispositions of property and equipment 7 1 —
Gain on forgiveness of debt (8) — (90)
Gain on sale of investments (1) (17) —
Goodwill impairment 622 — —
Impairment on auction rate securities 214 10 —
Impairment on fixed assets 13 — —
Utilization of acquired net operating loss carryforwards — 7 85
Change in fair value of fuel hedging instruments, net 496 (187) 70
Amortization of deferred credits and rent (41) (40) (38)
Amortization of debt discount and debt issuance costs 20 14 16
Amortization of actuarial gains (2) — —
Stock-based compensation 34 32 34
Debt extinguishment costs 7 18 7
Premium paid in conversion of 7% senior convertible notes — — 17
Other — — (1)
Changes in operating assets and liabilities:
Decrease (increase) in restricted cash (184) (1) 6
Decrease (increase) in accounts receivable, net 74 14 (35)
Decrease (increase) in materials and supplies, net 49 (18) (25)
Decrease (increase) in prepaid expenses and other (259) (52) 22
Decrease (increase) in other assets, net 4 (5) 9
Increase (decrease) in accounts payable 96 (11) (2)
Increase (decrease) in air traffic liability (134) (22) 59
Increase (decrease) in accrued compensation and vacation (67) (37) 56
Increase (decrease) in accrued taxes (10) (29) 38
Increase (decrease) in other liabilities 60 140 (86)
Net cash provided by (used in) operating activities (980) 451 643
Cash flows from investing activities:
Purchases of property and equipment (929) (523) (232)
Purchases of marketable securities (299) (2,591) (2,583)
Sales of marketable securities 505 3,203 1,785
Proceeds from sale of other investments 4 56 —
Decrease (increase) in long-term restricted cash (74) 200 128
Proceeds from dispositions of property and equipment 17 4 7
Increase in equipment purchase deposits (139) (80) (8)
Net cash provided by (used in) investing activities (915) 269 (903)
Cash flows from financing activities:
Repayments of debt and capital lease obligations (734) (1,680) (1,187)
Proceeds from issuance of debt 1,586 1,798 1,419
Deferred financing costs (50) (9) (25)
Proceeds from issuance of common stock, net 179 3 44
Net cash provided by financing activities 981 112 251
Net increase (decrease) in cash and cash equivalents (914) 832 (9)
Cash and cash equivalents at beginning of year 1,948 1,116 1,125
Cash and cash equivalents at end of year $ 1,034 $ 1,948 $ 1,116
See accompanying notes to consolidated financial statements.
82