US Airways 2008 Annual Report Download - page 60
Download and view the complete annual report
Please find page 60 of the 2008 US Airways annual report below. You can navigate through the pages in the report by either clicking on the pages listed below, or by using the keyword search tool below to find specific information within the annual report.-
 1
1 -
2
-
3
-
4
-
5
-
6
-
7
-
8
-
9
-
10
-
11
-
12
-
13
-
14
-
15
-
16
-
17
-
18
-
19
-
20
-
21
-
22
-
23
-
24
-
25
-
26
-
27
-
28
-
29
-
30
-
31
-
32
-
33
-
34
-
35
-
36
-
37
-
38
-
39
-
40
-
41
-
42
-
43
-
44
-
45
-
46
-
47
-
48
-
49
-
 50
50 -
 51
51 -
 52
52 -
 53
53 -
 54
54 -
 55
55 -
 56
56 -
 57
57 -
 58
58 -
 59
59 -
 60
60 -
 61
61 -
 62
62 -
 63
63 -
 64
64 -
 65
65 -
 66
66 -
 67
67 -
 68
68 -
 69
69 -
 70
70 -
71
-
72
-
73
-
74
-
75
-
76
-
77
-
78
-
79
-
80
-
81
-
82
-
83
-
84
-
85
-
86
-
87
-
88
-
89
-
90
-
91
-
92
-
93
-
94
-
95
-
96
-
97
-
98
-
99
-
100
-
101
-
102
-
103
-
104
-
105
-
106
-
107
-
108
-
109
-
110
-
111
-
112
-
113
-
114
-
115
-
116
-
117
-
118
-
119
-
120
-
121
-
122
-
123
-
124
-
125
-
126
-
127
-
128
-
129
-
130
-
131
-
132
-
133
-
134
-
135
-
136
-
137
-
138
-
139
-
140
-
141
-
142
-
143
-
144
-
145
-
146
-
147
-
148
-
149
-
150
-
151
-
152
-
153
-
154
-
155
-
156
-
157
-
158
-
159
-
160
-
161
-
162
-
163
-
164
-
165
-
166
-
167
-
168
-
169
-
170
-
171
-
172
-
173
-
174
-
175
-
176
-
177
-
178
-
179
-
180
-
181
-
182
-
183
-
184
-
185
-
186
-
187
-
188
-
189
-
190
-
191
-
192
-
193
-
194
-
195
-
196
-
197
-
198
-
199
-
200
-
201
-
202
-
203
-
204
-
205
-
206
-
207
-
208
-
209
-
210
-
211
-
212
-
213
-
214
-
215
-
216
-
217
-
218
-
219
-
220
-
221
-
222
-
223
-
224
-
225
-
226
-
227
-
228
-
229
-
230
-
231
-
232
-
233
-
234
-
235
-
236
-
237
-
238
-
239
-
240
-
241
-
242
-
243
-
244
-
245
-
246
-
247
-
248
-
249
-
250
-
251
-
252
-
253
-
254
-
255
-
256
-
257
-
258
-
259
-
260
-
261
-
262
-
263
-
264
-
265
-
266
-
267
-
268
-
269
-
270
-
271
-
272
-
273
-
274
-
275
-
276
-
277
-
278
-
279
-
280
-
281
-
282
-
283
-
284
-
285
-
286
-
287
-
288
-
289
-
290
-
291
-
292
-
293
-
294
-
295
-
296
-
297
-
298
-
299
-
300
-
301
-
302
-
303
-
304
-
305
-
306
-
307
-
308
-
309
-
310
-
311
-
312
-
313
-
314
-
315
-
316
-
317
-
318
-
319
-
320
-
321
-
322
-
323
-
324
-
325
-
326
-
327
-
328
-
329
-
330
-
331
-
332
-
333
-
334
-
335
-
336
-
337
-
338
-
339
-
340
-
341
-
342
-
343
-
344
-
345
-
346
-
347
-
348
-
349
-
350
-
351
-
352
-
353
-
354
-
355
-
356
-
357
-
358
-
359
-
360
-
361
-
362
-
363
-
364
-
365
-
366
-
367
-
368
-
369
-
370
-
371
-
372
-
373
-
374
-
375
-
376
-
377
-
378
-
379
-
380
-
381
-
382
-
383
-
384
-
385
-
386
-
387
-
388
-
389
-
390
-
391
-
392
-
393
-
394
-
395
-
396
-
397
-
398
-
399
-
400
-
401
 |
 |

Table of Contents
maturities for these auction rate securities range from eight to 44 years, with 62% of our portfolio maturing within the next ten years,
10% maturing within the next 20 years, 16% maturing within the next 30 years and 12% maturing thereafter through 2052. The interest
rates are reset approximately every 28 days, except one security for which the auction process is currently suspended. Current yields
range from 1.76% to 6.08%. With the liquidity issues experienced in the global credit and capital markets, all of our auction rate
securities have experienced failed auctions since August 2007. The estimated fair value of these auction rate securities no longer
approximates par value. However, we have not experienced any defaults and continue to earn and receive interest at the maximum
contractual rates.
We estimated the fair value of these auction rate securities based on the following: (i) the underlying structure of each security;
(ii) the present value of future principal and interest payments discounted at rates considered to reflect current market conditions;
(iii) consideration of the probabilities of default, passing a future auction, or repurchase at par for each period; and (iv) estimates of the
recovery rates in the event of default for each security. These estimated fair values could change significantly based on future market
conditions.
At December 31, 2007, the $411 million par value auction rate securities had a fair value of $353 million, a $58 million decline
from par. Of this decline in fair value, $48 million was deemed temporary and an unrealized loss in this amount was recorded to other
comprehensive income. We concluded $10 million of the decline was an other than temporary impairment as a single security with
subprime exposure experienced a severe decline in fair value during the period. Accordingly, the $10 million impairment charge was
recorded to other nonoperating expense, net in the fourth quarter of 2007.
At December 31, 2008, the fair value of our auction rate securities was $187 million, representing a decline in fair value of
$166 million from December 31, 2007. The decline in fair value was caused by the significant deterioration in the financial markets in
2008. We concluded that the 2008 decline in fair value of $166 million as well as the previously deemed temporary declines recorded to
other comprehensive income of $48 million were now other than temporary. Our conclusion for the other than temporary impairment was
due to the length of time and extent to which the fair value has been less than cost for certain securities. All of these securities have
experienced failed auctions for a period greater than one year, and there has been no recovery in their fair value. Accordingly, we
recorded $214 million in impairment charges in other nonoperating expense, net related to the other than temporary impairment of our
auction rate securities. We continue to monitor the market for auction rate securities and consider its impact (if any) on the fair value of
our investments. If the current market conditions deteriorate further, we may be required to record additional impairment charges in other
nonoperating expense, net in future periods.
We do not anticipate having to sell these securities in order to operate our business. We believe that, based on our current
unrestricted cash, cash equivalents and short-term marketable securities balances of $1.05 billion as of December 31, 2008, the current
lack of liquidity in our investments in auction rate securities will not have a material impact on our liquidity, our cash flow or our ability
to fund our operations.
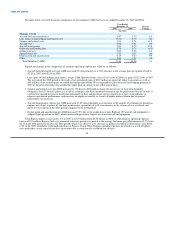
Aviation Fuel and Derivative Instruments
Because our operations are dependent upon aviation fuel, significant increases in aviation fuel costs materially and adversely affect
our liquidity, results of operations and financial condition. Our 2009 forecasted mainline and Express fuel consumption is approximately
1.44 billion gallons, and a one cent per gallon increase in aviation fuel price results in a $14 million annual increase in expense, excluding
the impact of hedge transactions.
As of December 31, 2008, we have entered into no premium collars, which establish an upper and lower limit on heating oil futures
prices, to protect us from fuel price risks. These transactions are in place with respect to approximately 14% of our projected mainline
and Express 2009 fuel requirements at a weighted average collar range of $3.41 to $3.61 per gallon of heating oil or $131.15 to $139.55
per barrel of estimated crude oil equivalent.
The use of such hedging transactions in our fuel hedging program could result in us not fully benefiting from certain declines in
heating oil futures prices. As of December 31, 2008, the fair value of our fuel hedging instruments was a net liability of $375 million.
Further, these instruments do not provide protection from future price increases unless heating oil prices exceed the call option price of
the no premium collar. Although heating oil
58