US Airways 2008 Annual Report Download - page 47
Download and view the complete annual report
Please find page 47 of the 2008 US Airways annual report below. You can navigate through the pages in the report by either clicking on the pages listed below, or by using the keyword search tool below to find specific information within the annual report.-
 1
1 -
2
-
3
-
4
-
5
-
6
-
7
-
8
-
9
-
10
-
11
-
12
-
13
-
14
-
15
-
16
-
17
-
18
-
19
-
20
-
21
-
22
-
23
-
24
-
25
-
26
-
27
-
28
-
29
-
30
-
31
-
32
-
33
-
34
-
35
-
36
-
 37
37 -
 38
38 -
 39
39 -
 40
40 -
 41
41 -
 42
42 -
 43
43 -
 44
44 -
 45
45 -
 46
46 -
 47
47 -
 48
48 -
 49
49 -
 50
50 -
 51
51 -
 52
52 -
 53
53 -
 54
54 -
 55
55 -
 56
56 -
 57
57 -
58
-
59
-
60
-
61
-
62
-
63
-
64
-
65
-
66
-
67
-
68
-
69
-
70
-
71
-
72
-
73
-
74
-
75
-
76
-
77
-
78
-
79
-
80
-
81
-
82
-
83
-
84
-
85
-
86
-
87
-
88
-
89
-
90
-
91
-
92
-
93
-
94
-
95
-
96
-
97
-
98
-
99
-
100
-
101
-
102
-
103
-
104
-
105
-
106
-
107
-
108
-
109
-
110
-
111
-
112
-
113
-
114
-
115
-
116
-
117
-
118
-
119
-
120
-
121
-
122
-
123
-
124
-
125
-
126
-
127
-
128
-
129
-
130
-
131
-
132
-
133
-
134
-
135
-
136
-
137
-
138
-
139
-
140
-
141
-
142
-
143
-
144
-
145
-
146
-
147
-
148
-
149
-
150
-
151
-
152
-
153
-
154
-
155
-
156
-
157
-
158
-
159
-
160
-
161
-
162
-
163
-
164
-
165
-
166
-
167
-
168
-
169
-
170
-
171
-
172
-
173
-
174
-
175
-
176
-
177
-
178
-
179
-
180
-
181
-
182
-
183
-
184
-
185
-
186
-
187
-
188
-
189
-
190
-
191
-
192
-
193
-
194
-
195
-
196
-
197
-
198
-
199
-
200
-
201
-
202
-
203
-
204
-
205
-
206
-
207
-
208
-
209
-
210
-
211
-
212
-
213
-
214
-
215
-
216
-
217
-
218
-
219
-
220
-
221
-
222
-
223
-
224
-
225
-
226
-
227
-
228
-
229
-
230
-
231
-
232
-
233
-
234
-
235
-
236
-
237
-
238
-
239
-
240
-
241
-
242
-
243
-
244
-
245
-
246
-
247
-
248
-
249
-
250
-
251
-
252
-
253
-
254
-
255
-
256
-
257
-
258
-
259
-
260
-
261
-
262
-
263
-
264
-
265
-
266
-
267
-
268
-
269
-
270
-
271
-
272
-
273
-
274
-
275
-
276
-
277
-
278
-
279
-
280
-
281
-
282
-
283
-
284
-
285
-
286
-
287
-
288
-
289
-
290
-
291
-
292
-
293
-
294
-
295
-
296
-
297
-
298
-
299
-
300
-
301
-
302
-
303
-
304
-
305
-
306
-
307
-
308
-
309
-
310
-
311
-
312
-
313
-
314
-
315
-
316
-
317
-
318
-
319
-
320
-
321
-
322
-
323
-
324
-
325
-
326
-
327
-
328
-
329
-
330
-
331
-
332
-
333
-
334
-
335
-
336
-
337
-
338
-
339
-
340
-
341
-
342
-
343
-
344
-
345
-
346
-
347
-
348
-
349
-
350
-
351
-
352
-
353
-
354
-
355
-
356
-
357
-
358
-
359
-
360
-
361
-
362
-
363
-
364
-
365
-
366
-
367
-
368
-
369
-
370
-
371
-
372
-
373
-
374
-
375
-
376
-
377
-
378
-
379
-
380
-
381
-
382
-
383
-
384
-
385
-
386
-
387
-
388
-
389
-
390
-
391
-
392
-
393
-
394
-
395
-
396
-
397
-
398
-
399
-
400
-
401
 |
 |

Table of Contents
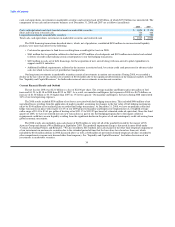
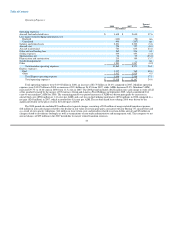
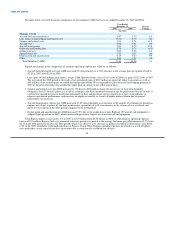
The table below sets forth the major components of our mainline CASM for the years ended December 31, 2008 and 2007:
Year Ended
December 31, Percent
2008 2007 Change
(In cents)
Mainline CASM:
Aircraft fuel and related taxes 4.88 3.47 40.7
Loss (gain) on fuel hedging instruments, net 0.48 (0.32) nm
Salaries and related costs 3.01 3.03 (0.8)
Aircraft rent 0.98 0.96 2.2
Aircraft maintenance 1.05 0.84 25.4
Other rent and landing fees 0.76 0.70 7.6
Selling expenses 0.59 0.60 (1.2)
Special items, net 0.10 0.13 (23.2)
Depreciation and amortization 0.29 0.25 16.4
Goodwill impairment 0.84 — nm
Other 1.68 1.64 2.2
Total mainline CASM 14.66 11.30 29.7
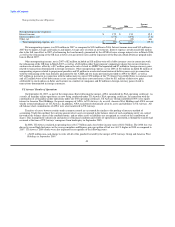
Significant changes in the components of mainline operating expense per ASM are as follows:
• Aircraft fuel and related taxes per ASM increased 40.7% due primarily to a 43.9% increase in the average price per gallon of fuel
to a record high $3.17 in 2008 from $2.20 in 2007, offset by a 4.4% decrease in gallons consumed.
• Loss (gain) on fuel hedging instruments, net per ASM fluctuated from a gain of 0.32 cents in 2007 to a loss of 0.48 cents in 2008.
The net loss in the 2008 period is the result of net unrealized losses of $496 million on open fuel hedge transactions, offset by
$140 million of net realized gains on settled fuel hedge transactions. Our fuel hedging program uses no premium collars, which
establish an upper and lower limit on heating oil futures prices, to provide protection from fuel price risks. We use heating oil as
it is a commodity with prices that are generally highly correlated with jet fuel prices. We recognized net gains from our fuel
hedging program in the first half of 2008 as the price of heating oil exceeded the upper limit on certain of our collar transactions.
However, the significant decline in the price of oil in the latter part of 2008 generated unrealized losses on certain open fuel
hedge transactions as the price of heating oil fell below the lower limit of those collar transactions.
• Aircraft maintenance expense per ASM increased 25.4% due principally to increases in the number of engine and landing gear
overhauls performed in 2008 as compared to 2007.
• Other rent and landing fees per ASM increased 7.6% due primarily to increases in rental rates at certain airports in the 2008
period as compared to the 2007 period.
• Depreciation and amortization per ASM increased 16.4% due to the acquisition of 14 Embraer aircraft and five Airbus aircraft in
2008, which increased depreciation expense on owned aircraft.
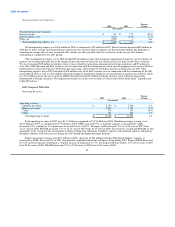
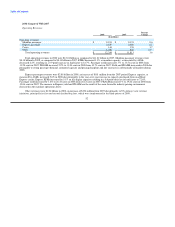
Total Express expenses increased 17.5% in 2008 to $3.05 billion from $2.59 billion in 2007. Express fuel costs increased
$372 million as the average fuel price per gallon increased 44.8% from $2.23 in 2007 to a record high $3.23 in 2008. Other Express
operating expenses increased $83 million year-over-year as a result of the 5.6% increase in Express capacity in 2008.
45