US Airways 2008 Annual Report Download - page 48
Download and view the complete annual report
Please find page 48 of the 2008 US Airways annual report below. You can navigate through the pages in the report by either clicking on the pages listed below, or by using the keyword search tool below to find specific information within the annual report.-
 1
1 -
2
-
3
-
4
-
5
-
6
-
7
-
8
-
9
-
10
-
11
-
12
-
13
-
14
-
15
-
16
-
17
-
18
-
19
-
20
-
21
-
22
-
23
-
24
-
25
-
26
-
27
-
28
-
29
-
30
-
31
-
32
-
33
-
34
-
35
-
36
-
37
-
 38
38 -
 39
39 -
 40
40 -
 41
41 -
 42
42 -
 43
43 -
 44
44 -
 45
45 -
 46
46 -
 47
47 -
 48
48 -
 49
49 -
 50
50 -
 51
51 -
 52
52 -
 53
53 -
 54
54 -
 55
55 -
 56
56 -
 57
57 -
 58
58 -
59
-
60
-
61
-
62
-
63
-
64
-
65
-
66
-
67
-
68
-
69
-
70
-
71
-
72
-
73
-
74
-
75
-
76
-
77
-
78
-
79
-
80
-
81
-
82
-
83
-
84
-
85
-
86
-
87
-
88
-
89
-
90
-
91
-
92
-
93
-
94
-
95
-
96
-
97
-
98
-
99
-
100
-
101
-
102
-
103
-
104
-
105
-
106
-
107
-
108
-
109
-
110
-
111
-
112
-
113
-
114
-
115
-
116
-
117
-
118
-
119
-
120
-
121
-
122
-
123
-
124
-
125
-
126
-
127
-
128
-
129
-
130
-
131
-
132
-
133
-
134
-
135
-
136
-
137
-
138
-
139
-
140
-
141
-
142
-
143
-
144
-
145
-
146
-
147
-
148
-
149
-
150
-
151
-
152
-
153
-
154
-
155
-
156
-
157
-
158
-
159
-
160
-
161
-
162
-
163
-
164
-
165
-
166
-
167
-
168
-
169
-
170
-
171
-
172
-
173
-
174
-
175
-
176
-
177
-
178
-
179
-
180
-
181
-
182
-
183
-
184
-
185
-
186
-
187
-
188
-
189
-
190
-
191
-
192
-
193
-
194
-
195
-
196
-
197
-
198
-
199
-
200
-
201
-
202
-
203
-
204
-
205
-
206
-
207
-
208
-
209
-
210
-
211
-
212
-
213
-
214
-
215
-
216
-
217
-
218
-
219
-
220
-
221
-
222
-
223
-
224
-
225
-
226
-
227
-
228
-
229
-
230
-
231
-
232
-
233
-
234
-
235
-
236
-
237
-
238
-
239
-
240
-
241
-
242
-
243
-
244
-
245
-
246
-
247
-
248
-
249
-
250
-
251
-
252
-
253
-
254
-
255
-
256
-
257
-
258
-
259
-
260
-
261
-
262
-
263
-
264
-
265
-
266
-
267
-
268
-
269
-
270
-
271
-
272
-
273
-
274
-
275
-
276
-
277
-
278
-
279
-
280
-
281
-
282
-
283
-
284
-
285
-
286
-
287
-
288
-
289
-
290
-
291
-
292
-
293
-
294
-
295
-
296
-
297
-
298
-
299
-
300
-
301
-
302
-
303
-
304
-
305
-
306
-
307
-
308
-
309
-
310
-
311
-
312
-
313
-
314
-
315
-
316
-
317
-
318
-
319
-
320
-
321
-
322
-
323
-
324
-
325
-
326
-
327
-
328
-
329
-
330
-
331
-
332
-
333
-
334
-
335
-
336
-
337
-
338
-
339
-
340
-
341
-
342
-
343
-
344
-
345
-
346
-
347
-
348
-
349
-
350
-
351
-
352
-
353
-
354
-
355
-
356
-
357
-
358
-
359
-
360
-
361
-
362
-
363
-
364
-
365
-
366
-
367
-
368
-
369
-
370
-
371
-
372
-
373
-
374
-
375
-
376
-
377
-
378
-
379
-
380
-
381
-
382
-
383
-
384
-
385
-
386
-
387
-
388
-
389
-
390
-
391
-
392
-
393
-
394
-
395
-
396
-
397
-
398
-
399
-
400
-
401
 |
 |

Table of Contents
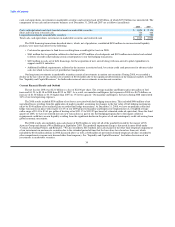
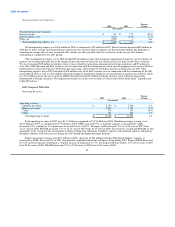
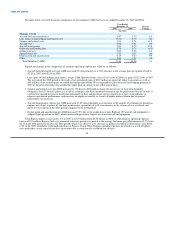
Nonoperating Income (Expense):
Percent
2008 2007 Change
(In millions)
Nonoperating income (expense):
Interest income $ 83 $ 172 (51.6)
Interest expense, net (253) (273) (7.3)
Other, net (240) 2 nm
Total nonoperating expense, net $ (410) $ (99) nm
Net nonoperating expense was $410 million in 2008 as compared to $99 million in 2007. Interest income decreased $89 million in
2008 due to lower average investment balances and lower rates of return. Interest expense, net decreased $20 million due primarily to
reductions in average interest rates associated with variable rate debt, partially offset by an increase in the average debt balance
outstanding as compared to the 2007 period.
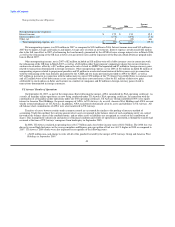
Other nonoperating expense, net in 2008 included $214 million in other than temporary impairment charges for our investments in
auction rate securities primarily due to the length of time and extent to which the fair value has been less than cost for these securities.
We also recognized $25 million in foreign currency losses related to transactions denominated in foreign currencies and $7 million in
write offs of debt discount and debt issuance costs in connection with the refinancing of certain aircraft equipment notes and certain loan
prepayments in connection with our 2008 financing transactions, offset in part by $8 million in gains on forgiveness of debt. Other
nonoperating expense, net in 2007 included an $18 million write off of debt issuance costs in connection with the refinancing of the GE
loan in March 2007 as well as a $10 million other than temporary impairment charge for our investments in auction rate securities, offset
by a $17 million gain on the sale of stock in ARINC Incorporated and $7 million in foreign currency gains related to transactions
denominated in foreign currencies. The impairment charges on auction rate securities are discussed in more detail under "Liquidity and
Capital Resources."
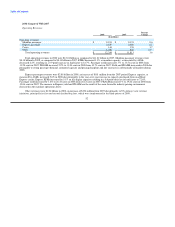
2007 Compared With 2006
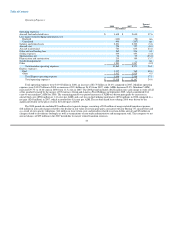
Operating Revenues:
Percent
2007 2006 Change
(In millions)
Operating revenues:
Mainline passenger $ 8,135 $ 7,966 2.1
Express passenger 2,698 2,744 (1.7)
Cargo 138 153 (9.4)
Other 729 694 4.9
Total operating revenues $ 11,700 $ 11,557 1.2
Total operating revenues in 2007 were $11.7 billion as compared to $11.56 billion in 2006. Mainline passenger revenues were
$8.14 billion in 2007, as compared to $7.97 billion in 2006. RPMs increased 0.9% as mainline capacity, as measured by ASMs,
decreased 1.5%, resulting in a 2.0 point increase in load factor to 80.8%. Passenger yield increased 1.2% to 13.28 cents in 2007 from
13.13 cents in 2006. PRASM increased 3.7% to 10.73 cents in 2007 from 10.35 cents in 2006. The increases in yield and PRASM are due
principally to the strong revenue environment in 2007 resulting from reductions in industry capacity and continued capacity and pricing
discipline, industry wide fare increases during the 2007 period and higher passenger demand.
Express passenger revenues were $2.7 billion in 2007, a decrease of $46 million from the 2006 period. Express capacity, as
measured by ASMs, decreased 5% in 2007, due primarily to planned reductions in Express flying during 2007. Express RPMs decreased
by 2.6% on lower capacity resulting in a 1.8 point increase in load factor to 73%. Passenger yield increased by 1% to 26.12 cents in 2007
from 25.86 cents in 2006. PRASM increased 3.5% to 19.06 cents in 2007 from 18.42 cents in 2006.
46