US Airways 2008 Annual Report Download - page 109
Download and view the complete annual report
Please find page 109 of the 2008 US Airways annual report below. You can navigate through the pages in the report by either clicking on the pages listed below, or by using the keyword search tool below to find specific information within the annual report.-
 1
1 -
2
-
3
-
4
-
5
-
6
-
7
-
8
-
9
-
10
-
11
-
12
-
13
-
14
-
15
-
16
-
17
-
18
-
19
-
20
-
21
-
22
-
23
-
24
-
25
-
26
-
27
-
28
-
29
-
30
-
31
-
32
-
33
-
34
-
35
-
36
-
37
-
38
-
39
-
40
-
41
-
42
-
43
-
44
-
45
-
46
-
47
-
48
-
49
-
50
-
51
-
52
-
53
-
54
-
55
-
56
-
57
-
58
-
59
-
60
-
61
-
62
-
63
-
64
-
65
-
66
-
67
-
68
-
69
-
70
-
71
-
72
-
73
-
74
-
75
-
76
-
77
-
78
-
79
-
80
-
81
-
82
-
83
-
84
-
85
-
86
-
87
-
88
-
89
-
90
-
91
-
92
-
93
-
94
-
95
-
96
-
97
-
98
-
 99
99 -
 100
100 -
 101
101 -
 102
102 -
 103
103 -
 104
104 -
 105
105 -
 106
106 -
 107
107 -
 108
108 -
 109
109 -
 110
110 -
 111
111 -
 112
112 -
 113
113 -
 114
114 -
 115
115 -
 116
116 -
 117
117 -
 118
118 -
 119
119 -
120
-
121
-
122
-
123
-
124
-
125
-
126
-
127
-
128
-
129
-
130
-
131
-
132
-
133
-
134
-
135
-
136
-
137
-
138
-
139
-
140
-
141
-
142
-
143
-
144
-
145
-
146
-
147
-
148
-
149
-
150
-
151
-
152
-
153
-
154
-
155
-
156
-
157
-
158
-
159
-
160
-
161
-
162
-
163
-
164
-
165
-
166
-
167
-
168
-
169
-
170
-
171
-
172
-
173
-
174
-
175
-
176
-
177
-
178
-
179
-
180
-
181
-
182
-
183
-
184
-
185
-
186
-
187
-
188
-
189
-
190
-
191
-
192
-
193
-
194
-
195
-
196
-
197
-
198
-
199
-
200
-
201
-
202
-
203
-
204
-
205
-
206
-
207
-
208
-
209
-
210
-
211
-
212
-
213
-
214
-
215
-
216
-
217
-
218
-
219
-
220
-
221
-
222
-
223
-
224
-
225
-
226
-
227
-
228
-
229
-
230
-
231
-
232
-
233
-
234
-
235
-
236
-
237
-
238
-
239
-
240
-
241
-
242
-
243
-
244
-
245
-
246
-
247
-
248
-
249
-
250
-
251
-
252
-
253
-
254
-
255
-
256
-
257
-
258
-
259
-
260
-
261
-
262
-
263
-
264
-
265
-
266
-
267
-
268
-
269
-
270
-
271
-
272
-
273
-
274
-
275
-
276
-
277
-
278
-
279
-
280
-
281
-
282
-
283
-
284
-
285
-
286
-
287
-
288
-
289
-
290
-
291
-
292
-
293
-
294
-
295
-
296
-
297
-
298
-
299
-
300
-
301
-
302
-
303
-
304
-
305
-
306
-
307
-
308
-
309
-
310
-
311
-
312
-
313
-
314
-
315
-
316
-
317
-
318
-
319
-
320
-
321
-
322
-
323
-
324
-
325
-
326
-
327
-
328
-
329
-
330
-
331
-
332
-
333
-
334
-
335
-
336
-
337
-
338
-
339
-
340
-
341
-
342
-
343
-
344
-
345
-
346
-
347
-
348
-
349
-
350
-
351
-
352
-
353
-
354
-
355
-
356
-
357
-
358
-
359
-
360
-
361
-
362
-
363
-
364
-
365
-
366
-
367
-
368
-
369
-
370
-
371
-
372
-
373
-
374
-
375
-
376
-
377
-
378
-
379
-
380
-
381
-
382
-
383
-
384
-
385
-
386
-
387
-
388
-
389
-
390
-
391
-
392
-
393
-
394
-
395
-
396
-
397
-
398
-
399
-
400
-
401
 |
 |

Table of Contents
US Airways Group, Inc.
Notes to Consolidated Financial Statements — (Continued)
regional airline affiliates. These receivables are short-term, mostly being settled within seven days after sale. Bad debt losses, which have
been minimal in the past, have been considered in establishing allowances for doubtful accounts. The Company does not believe it is
subject to any significant concentration of credit risk.
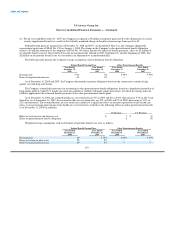
(c) Interest Rate Risk
The Company has exposure to market risk associated with changes in interest rates related primarily to its variable rate debt
obligations. Interest rates on $2.8 billion principal amount of long-term debt as of December 31, 2008 are subject to adjustment to reflect
changes in floating interest rates. The weighted average effective interest rate on the Company's variable rate debt was 4.33% at
December 31, 2008.
The fair value of the Company's long-term debt was approximately $3.31 billion and $3.23 billion at December 31, 2008 and 2007,
respectively. The fair values were estimated using quoted market prices where available. For long-term debt not actively traded, fair
values were estimated using a discounted cash flow analysis, based on the Company's current incremental borrowing rates for similar
types of borrowing arrangements.
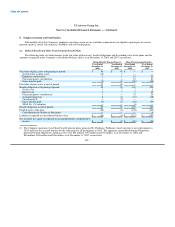
7. Fair value measurements
As described in Note 1(s), the Company adopted SFAS No. 157 on January 1, 2008. SFAS No. 157, among other things, defines
fair value, establishes a consistent framework for measuring fair value and expands disclosure for each major asset and liability category
measured at fair value on either a recurring or nonrecurring basis. SFAS No. 157 clarifies that fair value is an exit price, representing the
amount that would be received to sell an asset or paid to transfer a liability in an orderly transaction between market participants. As
such, fair value is a market-based measurement that should be determined based on assumptions that market participants would use in
pricing an asset or liability. As a basis for considering such assumptions, SFAS No. 157 establishes a three-tier fair value hierarchy,
which prioritizes the inputs used in measuring fair value as follows:
Level 1. Observable inputs such as quoted prices in active markets;
Level 2. Inputs, other than the quoted prices in active markets, that are observable either directly or indirectly; and
Level 3. Unobservable inputs in which there is little or no market data, which require the reporting entity to develop its own
assumptions.
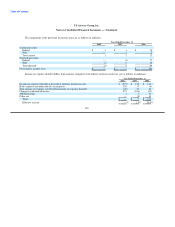
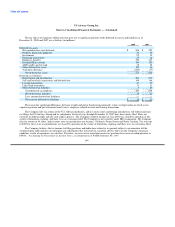
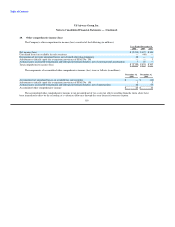
Assets measured at fair value on a recurring basis are as follows (in millions):
Quoted Prices in Significant Other Significant
Fair Value Active Markets for Observable Unobservable
December 31, Identical Assets Inputs Inputs Valuation
2008 (Level 1) (Level 2) (Level 3) Technique
Investments in marketable securities (noncurrent) $ 187 $ — $ — $ 187 (1)
Fuel hedging derivatives (375) — (375) — (2)
(1) The Company estimated the fair value of these auction rate securities based on the following: (i) the underlying structure of each
security; (ii) the present value of future principal and interest payments discounted at rates considered to reflect current market
conditions; (iii) consideration of the probabilities of default, passing a future auction, or repurchase at par for each period; and
(iv) estimates of the recovery rates in the event of default for each security. These estimated fair values could change significantly
based on future market conditions. Refer to Note 6(b) for further discussion of the Company's investments in marketable securities.
107