US Airways 2008 Annual Report Download - page 45
Download and view the complete annual report
Please find page 45 of the 2008 US Airways annual report below. You can navigate through the pages in the report by either clicking on the pages listed below, or by using the keyword search tool below to find specific information within the annual report.-
 1
1 -
2
-
3
-
4
-
5
-
6
-
7
-
8
-
9
-
10
-
11
-
12
-
13
-
14
-
15
-
16
-
17
-
18
-
19
-
20
-
21
-
22
-
23
-
24
-
25
-
26
-
27
-
28
-
29
-
30
-
31
-
32
-
33
-
34
-
 35
35 -
 36
36 -
 37
37 -
 38
38 -
 39
39 -
 40
40 -
 41
41 -
 42
42 -
 43
43 -
 44
44 -
 45
45 -
 46
46 -
 47
47 -
 48
48 -
 49
49 -
 50
50 -
 51
51 -
 52
52 -
 53
53 -
 54
54 -
 55
55 -
56
-
57
-
58
-
59
-
60
-
61
-
62
-
63
-
64
-
65
-
66
-
67
-
68
-
69
-
70
-
71
-
72
-
73
-
74
-
75
-
76
-
77
-
78
-
79
-
80
-
81
-
82
-
83
-
84
-
85
-
86
-
87
-
88
-
89
-
90
-
91
-
92
-
93
-
94
-
95
-
96
-
97
-
98
-
99
-
100
-
101
-
102
-
103
-
104
-
105
-
106
-
107
-
108
-
109
-
110
-
111
-
112
-
113
-
114
-
115
-
116
-
117
-
118
-
119
-
120
-
121
-
122
-
123
-
124
-
125
-
126
-
127
-
128
-
129
-
130
-
131
-
132
-
133
-
134
-
135
-
136
-
137
-
138
-
139
-
140
-
141
-
142
-
143
-
144
-
145
-
146
-
147
-
148
-
149
-
150
-
151
-
152
-
153
-
154
-
155
-
156
-
157
-
158
-
159
-
160
-
161
-
162
-
163
-
164
-
165
-
166
-
167
-
168
-
169
-
170
-
171
-
172
-
173
-
174
-
175
-
176
-
177
-
178
-
179
-
180
-
181
-
182
-
183
-
184
-
185
-
186
-
187
-
188
-
189
-
190
-
191
-
192
-
193
-
194
-
195
-
196
-
197
-
198
-
199
-
200
-
201
-
202
-
203
-
204
-
205
-
206
-
207
-
208
-
209
-
210
-
211
-
212
-
213
-
214
-
215
-
216
-
217
-
218
-
219
-
220
-
221
-
222
-
223
-
224
-
225
-
226
-
227
-
228
-
229
-
230
-
231
-
232
-
233
-
234
-
235
-
236
-
237
-
238
-
239
-
240
-
241
-
242
-
243
-
244
-
245
-
246
-
247
-
248
-
249
-
250
-
251
-
252
-
253
-
254
-
255
-
256
-
257
-
258
-
259
-
260
-
261
-
262
-
263
-
264
-
265
-
266
-
267
-
268
-
269
-
270
-
271
-
272
-
273
-
274
-
275
-
276
-
277
-
278
-
279
-
280
-
281
-
282
-
283
-
284
-
285
-
286
-
287
-
288
-
289
-
290
-
291
-
292
-
293
-
294
-
295
-
296
-
297
-
298
-
299
-
300
-
301
-
302
-
303
-
304
-
305
-
306
-
307
-
308
-
309
-
310
-
311
-
312
-
313
-
314
-
315
-
316
-
317
-
318
-
319
-
320
-
321
-
322
-
323
-
324
-
325
-
326
-
327
-
328
-
329
-
330
-
331
-
332
-
333
-
334
-
335
-
336
-
337
-
338
-
339
-
340
-
341
-
342
-
343
-
344
-
345
-
346
-
347
-
348
-
349
-
350
-
351
-
352
-
353
-
354
-
355
-
356
-
357
-
358
-
359
-
360
-
361
-
362
-
363
-
364
-
365
-
366
-
367
-
368
-
369
-
370
-
371
-
372
-
373
-
374
-
375
-
376
-
377
-
378
-
379
-
380
-
381
-
382
-
383
-
384
-
385
-
386
-
387
-
388
-
389
-
390
-
391
-
392
-
393
-
394
-
395
-
396
-
397
-
398
-
399
-
400
-
401
 |
 |

Table of Contents
(c) Passenger load factor — The percentage of available seats that are filled with revenue passengers.
(d) Yield — A measure of airline revenue derived by dividing passenger revenue by revenue passenger miles and expressed in cents per
mile.
(e) Passenger revenue per available seat mile ("PRASM") — Total passenger revenues divided by total available seat miles.
(f) Operating cost per available seat mile ("CASM") — Total mainline operating expenses divided by total available seat miles.
(g) Passenger enplanements — The number of passengers on board an aircraft including local, connecting and through passengers.
(h) Block hours — The hours measured from the moment an aircraft first moves under its own power, including taxi time, for the
purposes of flight until the aircraft is docked at the next point of landing and its power is shut down.
(i) Average stage length — The average of the distances flown on each segment of every route.
(j) Average passenger journey — The average one-way trip measured in statute miles for one passenger origination.
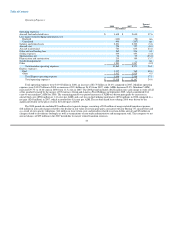
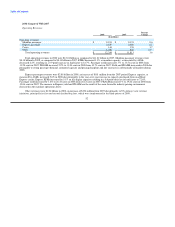
2008 Compared With 2007
Operating Revenues:
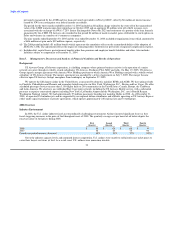
Percent
2008 2007 Change
(In millions)
Operating revenues:
Mainline passenger $ 8,183 $ 8,135 0.6
Express passenger 2,879 2,698 6.7
Cargo 144 138 3.7
Other 912 729 25.3
Total operating revenues $ 12,118 $ 11,700 3.6
Total operating revenues in 2008 were $12.12 billion as compared to $11.7 billion in 2007. Mainline passenger revenues were
$8.18 billion in 2008, as compared to $8.14 billion in 2007. RPMs decreased 1.1% as mainline capacity, as measured by ASMs,
decreased 2.2%, resulting in a 0.9 point increase in load factor to 81.7%. Passenger yield increased 1.7% to 13.51 cents in 2008 from
13.28 cents in 2007. PRASM increased 2.9% to 11.04 cents in 2008 from 10.73 cents in 2007. Yield and PRASM increased in 2008 due
principally to strong passenger demand, continued capacity and pricing discipline and fare increases in substantially all markets during
2008.
Express passenger revenues were $2.88 billion in 2008, an increase of $181 million from the 2007 period. Express capacity, as
measured by ASMs, increased 5.6% in 2008 due principally to the year-over-year increase in capacity purchased from an affiliate
Express carrier. Express RPMs increased by 5.1% on this higher capacity resulting in a 0.4 point decrease in load factor to 72.6%.
Passenger yield increased by 1.6% to 26.52 cents in 2008 from 26.12 cents in 2007. PRASM increased 1% to 19.26 cents in 2008 from
19.06 cents in 2007. The increase in Express yield and PRASM are the result of the same favorable industry pricing environment
discussed in the mainline operations above.
Other revenues were $912 million in 2008, an increase of $183 million from 2007 due primarily to our new revenue initiatives,
principally our first and second checked bag fees, which were implemented in the third quarter of 2008.
43