US Airways 2008 Annual Report Download - page 78
Download and view the complete annual report
Please find page 78 of the 2008 US Airways annual report below. You can navigate through the pages in the report by either clicking on the pages listed below, or by using the keyword search tool below to find specific information within the annual report.-
 1
1 -
2
-
3
-
4
-
5
-
6
-
7
-
8
-
9
-
10
-
11
-
12
-
13
-
14
-
15
-
16
-
17
-
18
-
19
-
20
-
21
-
22
-
23
-
24
-
25
-
26
-
27
-
28
-
29
-
30
-
31
-
32
-
33
-
34
-
35
-
36
-
37
-
38
-
39
-
40
-
41
-
42
-
43
-
44
-
45
-
46
-
47
-
48
-
49
-
50
-
51
-
52
-
53
-
54
-
55
-
56
-
57
-
58
-
59
-
60
-
61
-
62
-
63
-
64
-
65
-
66
-
67
-
 68
68 -
 69
69 -
 70
70 -
 71
71 -
 72
72 -
 73
73 -
 74
74 -
 75
75 -
 76
76 -
 77
77 -
 78
78 -
 79
79 -
 80
80 -
 81
81 -
 82
82 -
 83
83 -
 84
84 -
 85
85 -
 86
86 -
 87
87 -
 88
88 -
89
-
90
-
91
-
92
-
93
-
94
-
95
-
96
-
97
-
98
-
99
-
100
-
101
-
102
-
103
-
104
-
105
-
106
-
107
-
108
-
109
-
110
-
111
-
112
-
113
-
114
-
115
-
116
-
117
-
118
-
119
-
120
-
121
-
122
-
123
-
124
-
125
-
126
-
127
-
128
-
129
-
130
-
131
-
132
-
133
-
134
-
135
-
136
-
137
-
138
-
139
-
140
-
141
-
142
-
143
-
144
-
145
-
146
-
147
-
148
-
149
-
150
-
151
-
152
-
153
-
154
-
155
-
156
-
157
-
158
-
159
-
160
-
161
-
162
-
163
-
164
-
165
-
166
-
167
-
168
-
169
-
170
-
171
-
172
-
173
-
174
-
175
-
176
-
177
-
178
-
179
-
180
-
181
-
182
-
183
-
184
-
185
-
186
-
187
-
188
-
189
-
190
-
191
-
192
-
193
-
194
-
195
-
196
-
197
-
198
-
199
-
200
-
201
-
202
-
203
-
204
-
205
-
206
-
207
-
208
-
209
-
210
-
211
-
212
-
213
-
214
-
215
-
216
-
217
-
218
-
219
-
220
-
221
-
222
-
223
-
224
-
225
-
226
-
227
-
228
-
229
-
230
-
231
-
232
-
233
-
234
-
235
-
236
-
237
-
238
-
239
-
240
-
241
-
242
-
243
-
244
-
245
-
246
-
247
-
248
-
249
-
250
-
251
-
252
-
253
-
254
-
255
-
256
-
257
-
258
-
259
-
260
-
261
-
262
-
263
-
264
-
265
-
266
-
267
-
268
-
269
-
270
-
271
-
272
-
273
-
274
-
275
-
276
-
277
-
278
-
279
-
280
-
281
-
282
-
283
-
284
-
285
-
286
-
287
-
288
-
289
-
290
-
291
-
292
-
293
-
294
-
295
-
296
-
297
-
298
-
299
-
300
-
301
-
302
-
303
-
304
-
305
-
306
-
307
-
308
-
309
-
310
-
311
-
312
-
313
-
314
-
315
-
316
-
317
-
318
-
319
-
320
-
321
-
322
-
323
-
324
-
325
-
326
-
327
-
328
-
329
-
330
-
331
-
332
-
333
-
334
-
335
-
336
-
337
-
338
-
339
-
340
-
341
-
342
-
343
-
344
-
345
-
346
-
347
-
348
-
349
-
350
-
351
-
352
-
353
-
354
-
355
-
356
-
357
-
358
-
359
-
360
-
361
-
362
-
363
-
364
-
365
-
366
-
367
-
368
-
369
-
370
-
371
-
372
-
373
-
374
-
375
-
376
-
377
-
378
-
379
-
380
-
381
-
382
-
383
-
384
-
385
-
386
-
387
-
388
-
389
-
390
-
391
-
392
-
393
-
394
-
395
-
396
-
397
-
398
-
399
-
400
-
401
 |
 |

Table of Contents
also maintain industry-standard security agreements with all of our counterparties which may require the counterparty to post collateral if
the value of the fuel hedging derivatives exceeds specified thresholds related to the counterparty's credit ratings.
When our fuel hedging derivative instruments are in a net liability position, we are exposed to credit risks related to the return of
collateral in situations in which we have posted collateral with counterparties for unrealized losses. As of December 31, 2008, we were in
a net liability position of $375 million based on the fair value of our fuel hedging derivative instruments due to the significant decline in
the price of oil in the latter part of 2008. When possible, in order to mitigate the risk of posting collateral, we provide letters of credit to
certain counterparties in lieu of cash. At December 31, 2008, $185 million related to letters of credit collateralizing certain counterparties
to our fuel hedging transactions is included in short-term restricted cash. In addition, at December 31, 2008, we had $276 million in cash
deposits held by counterparties to our fuel hedging transactions. Since the third quarter of 2008, we have not entered into any new
transactions as part of our fuel hedging program due to the impact collateral requirements could have on our liquidity resulting from the
significant decline in the price of oil and counterparty credit risk arising from global economic uncertainty.
Further declines in heating oil prices would result in additional collateral requirements with our counterparties, unrealized losses on
our existing fuel hedging derivative instruments and realized losses at the time of settlement of these fuel hedging derivative instruments.
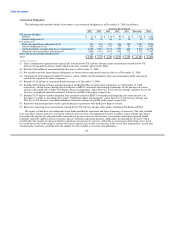
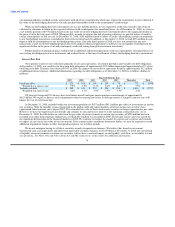
Interest Rate Risk
Our exposure to interest rate risk relates primarily to our cash equivalents, investment portfolios and variable rate debt obligations.
At December 31, 2008, our variable-rate long-term debt obligations of approximately $2.8 billion represented approximately 67% of our
total long-term debt. If interest rates increased 10% in 2008, the impact on our results of operations would be approximately $12 million
of additional interest expense. Additional information regarding our debt obligations as of December 31, 2008 is as follows (dollars in
millions):
Expected Maturity Date
2009 2010 2011 2012 2013 Thereafter Total
Fixed-rate debt $ 123 $ 105 $ 140 $ 139 $ 78 $ 771 $ 1,356
Weighted avg. interest rate 9.5% 9.5% 9.1% 8.6% 8.3% 7.5%
Variable-rate debt $ 249 $ 149 $ 233 $ 206 $ 130 $ 1,830 $ 2,797
Weighted avg. interest rate 4.2% 4.1% 3.9% 3.7% 3.5% 2.4%
US Airways Group and US Airways have total future aircraft and spare engine purchase commitments of approximately
$6.83 billion. We expect to finance such commitments either by entering into leases or debt agreements. Changes in interest rates will
impact the cost of such financings.
At December 31, 2008, included within our investment portfolio are $187 million ($411 million par value) of investments in auction
rate securities. With the liquidity issues experienced in the global credit and capital markets, all of our auction rate securities have
experienced failed auctions since August 2007. The estimated fair value of these auction rate securities no longer approximates par value.
However, we have not experienced any defaults and continue to earn and receive interest at the maximum contractual rates. As of
December 31, 2008, the full decline in value from the par value of our investments in auction rate securities of $224 million has been
recorded as an other than temporary impairment, of which $214 million was recorded in 2008. The decline in fair value was caused by
the significant deterioration in the financial markets in 2008. We continue to monitor the market for auction rate securities and consider
its impact (if any) on the fair value of our investments. If the current market conditions deteriorate further, we may be required to record
additional impairment charges in other nonoperating expense, net in future periods.
We do not anticipate having to sell these securities in order to operate our business. We believe that, based on our current
unrestricted cash, cash equivalents and short-term marketable securities balances of $1.05 billion at December 31, 2008, the current lack
of liquidity in our investments in auction rate securities will not have a material impact on our liquidity, cash flow, or our ability to fund
our operations. See Notes 6(b) and 5(b) in Items 8A and 8B, respectively, of this report for additional information.
76