US Airways 2008 Annual Report Download - page 38
Download and view the complete annual report
Please find page 38 of the 2008 US Airways annual report below. You can navigate through the pages in the report by either clicking on the pages listed below, or by using the keyword search tool below to find specific information within the annual report.-
 1
1 -
2
-
3
-
4
-
5
-
6
-
7
-
8
-
9
-
10
-
11
-
12
-
13
-
14
-
15
-
16
-
17
-
18
-
19
-
20
-
21
-
22
-
23
-
24
-
25
-
26
-
27
-
 28
28 -
 29
29 -
 30
30 -
 31
31 -
 32
32 -
 33
33 -
 34
34 -
 35
35 -
 36
36 -
 37
37 -
 38
38 -
 39
39 -
 40
40 -
 41
41 -
 42
42 -
 43
43 -
 44
44 -
 45
45 -
 46
46 -
 47
47 -
 48
48 -
49
-
50
-
51
-
52
-
53
-
54
-
55
-
56
-
57
-
58
-
59
-
60
-
61
-
62
-
63
-
64
-
65
-
66
-
67
-
68
-
69
-
70
-
71
-
72
-
73
-
74
-
75
-
76
-
77
-
78
-
79
-
80
-
81
-
82
-
83
-
84
-
85
-
86
-
87
-
88
-
89
-
90
-
91
-
92
-
93
-
94
-
95
-
96
-
97
-
98
-
99
-
100
-
101
-
102
-
103
-
104
-
105
-
106
-
107
-
108
-
109
-
110
-
111
-
112
-
113
-
114
-
115
-
116
-
117
-
118
-
119
-
120
-
121
-
122
-
123
-
124
-
125
-
126
-
127
-
128
-
129
-
130
-
131
-
132
-
133
-
134
-
135
-
136
-
137
-
138
-
139
-
140
-
141
-
142
-
143
-
144
-
145
-
146
-
147
-
148
-
149
-
150
-
151
-
152
-
153
-
154
-
155
-
156
-
157
-
158
-
159
-
160
-
161
-
162
-
163
-
164
-
165
-
166
-
167
-
168
-
169
-
170
-
171
-
172
-
173
-
174
-
175
-
176
-
177
-
178
-
179
-
180
-
181
-
182
-
183
-
184
-
185
-
186
-
187
-
188
-
189
-
190
-
191
-
192
-
193
-
194
-
195
-
196
-
197
-
198
-
199
-
200
-
201
-
202
-
203
-
204
-
205
-
206
-
207
-
208
-
209
-
210
-
211
-
212
-
213
-
214
-
215
-
216
-
217
-
218
-
219
-
220
-
221
-
222
-
223
-
224
-
225
-
226
-
227
-
228
-
229
-
230
-
231
-
232
-
233
-
234
-
235
-
236
-
237
-
238
-
239
-
240
-
241
-
242
-
243
-
244
-
245
-
246
-
247
-
248
-
249
-
250
-
251
-
252
-
253
-
254
-
255
-
256
-
257
-
258
-
259
-
260
-
261
-
262
-
263
-
264
-
265
-
266
-
267
-
268
-
269
-
270
-
271
-
272
-
273
-
274
-
275
-
276
-
277
-
278
-
279
-
280
-
281
-
282
-
283
-
284
-
285
-
286
-
287
-
288
-
289
-
290
-
291
-
292
-
293
-
294
-
295
-
296
-
297
-
298
-
299
-
300
-
301
-
302
-
303
-
304
-
305
-
306
-
307
-
308
-
309
-
310
-
311
-
312
-
313
-
314
-
315
-
316
-
317
-
318
-
319
-
320
-
321
-
322
-
323
-
324
-
325
-
326
-
327
-
328
-
329
-
330
-
331
-
332
-
333
-
334
-
335
-
336
-
337
-
338
-
339
-
340
-
341
-
342
-
343
-
344
-
345
-
346
-
347
-
348
-
349
-
350
-
351
-
352
-
353
-
354
-
355
-
356
-
357
-
358
-
359
-
360
-
361
-
362
-
363
-
364
-
365
-
366
-
367
-
368
-
369
-
370
-
371
-
372
-
373
-
374
-
375
-
376
-
377
-
378
-
379
-
380
-
381
-
382
-
383
-
384
-
385
-
386
-
387
-
388
-
389
-
390
-
391
-
392
-
393
-
394
-
395
-
396
-
397
-
398
-
399
-
400
-
401
 |
 |

Table of Contents
previously guaranteed by the ATSB and two loans previously provided to AWA by GECC, offset by $8 million of interest income
earned by AWA on certain prior year federal income tax refunds.
The period for the three months ended December 31, 2005 included an $8 million charge related to the write off of the unamortized
value of the ATSB warrants upon their repurchase in October 2005 and an aggregate $2 million write off of debt issuance costs
associated with the exchange of AWA's 7.25% Senior Exchangeable Notes due 2023 and retirement of a portion of the loan formerly
guaranteed by the ATSB. US Airways also recorded in this period $4 million of mark-to-market gains attributable to stock options in
Sabre and warrants in a number of e-commerce companies.
The nine months ended September 30, 2005 and the year ended December 31, 2004 included reorganization items which amounted to
a $636 million net gain and a $32 million expense, respectively.
(d) The 2006 period included a $1 million benefit which represents the cumulative effect on the accumulated deficit of the adoption of
SFAS No. 123R. The adjustment reflects the impact of estimating future forfeitures for previously recognized compensation expense.
(e) Includes debt, capital leases, postretirement benefits other than pensions and employee benefit liabilities and other. Also includes
liabilities subject to compromise at December 31, 2004.
Item 7. Management's Discussion and Analysis of Financial Condition and Results of Operations
Background
US Airways Group, a Delaware corporation, is a holding company whose primary business activity is the operation of a major
network air carrier through its wholly owned subsidiaries US Airways, Piedmont, PSA, MSC and AAL. On May 19, 2005, US Airways
Group signed a merger agreement with America West Holdings pursuant to which America West Holdings merged with a wholly owned
subsidiary of US Airways Group. The merger agreement was amended by a letter of agreement on July 7, 2005. The merger became
effective upon US Airways Group's emergence from bankruptcy on September 27, 2005.
We operate the fifth largest airline in the United States as measured by domestic mainline RPMs and ASMs. We have primary hubs
in Charlotte, Philadelphia and Phoenix and secondary hubs/focus cities in New York, Washington, D.C., Boston and Las Vegas. We offer
scheduled passenger service on more than 3,100 flights daily to 200 communities in the United States, Canada, Europe, the Caribbean
and Latin America. We also have an established East Coast route network, including the US Airways Shuttle service, with a substantial
presence at capacity constrained airports including New York's LaGuardia Airport and the Washington, D.C. area's Ronald Reagan
Washington National Airport. We had approximately 55 million passengers boarding our mainline flights in 2008. As of December 31,
2008, we operated 354 mainline jets and are supported by our regional airline subsidiaries and affiliates operating as US Airways Express
either under capacity purchase or prorate agreements, which operate approximately 238 regional jets and 74 turboprops.
2008 Overview
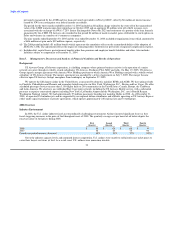
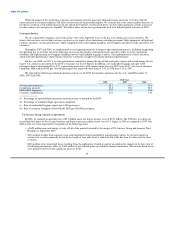
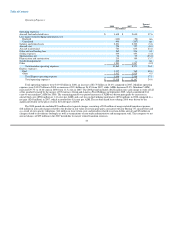
Industry Environment
In 2008, the U.S. airline industry faced an extraordinarily challenging environment. Airlines incurred significant losses as they
faced staggering increases in the price of fuel throughout most of 2008. The quarterly average cost per barrel of oil below depicts the
runaway nature of fuel prices during 2008:
First Second Third Fourth
Quarter Quarter Quarter Quarter
2008 $ 98 $ 124 $ 118 $ 59
2007 58 65 75 90
Period over period increase (decrease) 68% 91% 57% (35%)
Given the industry capacity levels and continued intense competition, U.S. airlines were unable to sufficiently raise ticket prices to
cover their largest cost item, jet fuel. As a result, most U.S. airlines were generating sizeable
36