US Airways 2008 Annual Report Download - page 59
Download and view the complete annual report
Please find page 59 of the 2008 US Airways annual report below. You can navigate through the pages in the report by either clicking on the pages listed below, or by using the keyword search tool below to find specific information within the annual report.-
 1
1 -
2
-
3
-
4
-
5
-
6
-
7
-
8
-
9
-
10
-
11
-
12
-
13
-
14
-
15
-
16
-
17
-
18
-
19
-
20
-
21
-
22
-
23
-
24
-
25
-
26
-
27
-
28
-
29
-
30
-
31
-
32
-
33
-
34
-
35
-
36
-
37
-
38
-
39
-
40
-
41
-
42
-
43
-
44
-
45
-
46
-
47
-
48
-
 49
49 -
 50
50 -
 51
51 -
 52
52 -
 53
53 -
 54
54 -
 55
55 -
 56
56 -
 57
57 -
 58
58 -
 59
59 -
 60
60 -
 61
61 -
 62
62 -
 63
63 -
 64
64 -
 65
65 -
 66
66 -
 67
67 -
 68
68 -
 69
69 -
70
-
71
-
72
-
73
-
74
-
75
-
76
-
77
-
78
-
79
-
80
-
81
-
82
-
83
-
84
-
85
-
86
-
87
-
88
-
89
-
90
-
91
-
92
-
93
-
94
-
95
-
96
-
97
-
98
-
99
-
100
-
101
-
102
-
103
-
104
-
105
-
106
-
107
-
108
-
109
-
110
-
111
-
112
-
113
-
114
-
115
-
116
-
117
-
118
-
119
-
120
-
121
-
122
-
123
-
124
-
125
-
126
-
127
-
128
-
129
-
130
-
131
-
132
-
133
-
134
-
135
-
136
-
137
-
138
-
139
-
140
-
141
-
142
-
143
-
144
-
145
-
146
-
147
-
148
-
149
-
150
-
151
-
152
-
153
-
154
-
155
-
156
-
157
-
158
-
159
-
160
-
161
-
162
-
163
-
164
-
165
-
166
-
167
-
168
-
169
-
170
-
171
-
172
-
173
-
174
-
175
-
176
-
177
-
178
-
179
-
180
-
181
-
182
-
183
-
184
-
185
-
186
-
187
-
188
-
189
-
190
-
191
-
192
-
193
-
194
-
195
-
196
-
197
-
198
-
199
-
200
-
201
-
202
-
203
-
204
-
205
-
206
-
207
-
208
-
209
-
210
-
211
-
212
-
213
-
214
-
215
-
216
-
217
-
218
-
219
-
220
-
221
-
222
-
223
-
224
-
225
-
226
-
227
-
228
-
229
-
230
-
231
-
232
-
233
-
234
-
235
-
236
-
237
-
238
-
239
-
240
-
241
-
242
-
243
-
244
-
245
-
246
-
247
-
248
-
249
-
250
-
251
-
252
-
253
-
254
-
255
-
256
-
257
-
258
-
259
-
260
-
261
-
262
-
263
-
264
-
265
-
266
-
267
-
268
-
269
-
270
-
271
-
272
-
273
-
274
-
275
-
276
-
277
-
278
-
279
-
280
-
281
-
282
-
283
-
284
-
285
-
286
-
287
-
288
-
289
-
290
-
291
-
292
-
293
-
294
-
295
-
296
-
297
-
298
-
299
-
300
-
301
-
302
-
303
-
304
-
305
-
306
-
307
-
308
-
309
-
310
-
311
-
312
-
313
-
314
-
315
-
316
-
317
-
318
-
319
-
320
-
321
-
322
-
323
-
324
-
325
-
326
-
327
-
328
-
329
-
330
-
331
-
332
-
333
-
334
-
335
-
336
-
337
-
338
-
339
-
340
-
341
-
342
-
343
-
344
-
345
-
346
-
347
-
348
-
349
-
350
-
351
-
352
-
353
-
354
-
355
-
356
-
357
-
358
-
359
-
360
-
361
-
362
-
363
-
364
-
365
-
366
-
367
-
368
-
369
-
370
-
371
-
372
-
373
-
374
-
375
-
376
-
377
-
378
-
379
-
380
-
381
-
382
-
383
-
384
-
385
-
386
-
387
-
388
-
389
-
390
-
391
-
392
-
393
-
394
-
395
-
396
-
397
-
398
-
399
-
400
-
401
 |
 |

Table of Contents
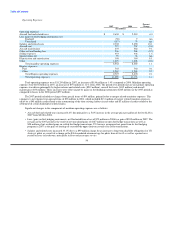
employees as part of US Airways' initiative to improve operational performance, and increases in employee benefits as a result of
higher medical claims due to general inflationary cost increases.
• Aircraft maintenance expense increased 9.1% due principally to an increase in the number of overhauls performed on engines not
subject to power by the hour maintenance agreements as well as an increase in the volume of seat overhauls and thrust reverser
repairs in the 2007 period compared to the 2006 period.
• Depreciation and amortization increased 8.1% due to the acquisition of nine Embraer 190 aircraft and equipment to support flight
operations in 2007, which increased depreciation expense on owned aircraft and equipment.
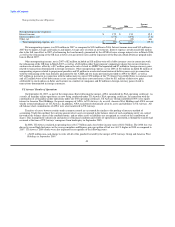
Total Express expenses increased 2.1% in 2007 to $2.73 billion from $2.67 billion in 2006, as other Express operating expenses
increased $56 million. Express fuel costs remained consistent period over period as the average fuel price per gallon increased 4.2% from
$2.14 in the 2006 period to $2.23 in the 2007 period, which was offset by a 4% decrease in gallons consumed as block hours were down
6.2% in the 2007 period due to planned reductions in Express flying. Other Express operating expenses increased as a result of higher
rates paid under certain capacity purchase agreements due to contractually scheduled rate changes.
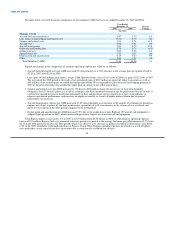
Nonoperating Income (Expense):
Percent
2007 2006 Change
(In millions)
Nonoperating income (expense):
Interest income $ 172 $ 153 12.5
Interest expense, net (229) (268) (14.4)
Other, net 18 4 nm
Total nonoperating expense, net $ (39) $ (111) (64.7)
Net nonoperating expense was $39 million in 2007 as compared to $111 million in 2006. Interest income increased $19 million in
2007 due to higher average cash balances and higher average rates of returns on investments. Interest expense, net decreased $39 million
due to the full year effect in 2007 of the refinancing by US Airways Group of the loan formerly guaranteed by the ATSB at lower average
interest rates in March 2006. The refinanced debt is no longer held by US Airways. Also contributing to lower interest expense was the
repayment by US Airways Group of the Barclays Bank Delaware prepaid miles loan in March 2007.
Other nonoperating income, net in 2007 of $18 million included a $17 million gain on the sale of stock in ARINC Incorporated as
well as $7 million in foreign currency gains related to transactions denominated in foreign currencies, offset by a $10 million other than
temporary impairment charge for US Airways' investments in auction rate securities. Other nonoperating income, net in 2006 of
$4 million included $11 million of derivative gains attributable to stock options in Sabre and warrants in a number of companies and
$2 million in foreign currency gains related to transactions denominated in foreign currencies, offset by $6 million of nonoperating
expense related to prepayment penalties and $5 million in accelerated amortization of debt issuance costs in connection with the
refinancing of the loan formerly guaranteed by the ATSB and two loans previously provided to AWA by GECC.
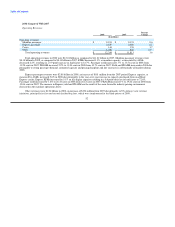
Liquidity and Capital Resources
As of December 31, 2008, our cash, cash equivalents, investments in marketable securities and restricted cash were $1.97 billion, of
which $1.24 billion was unrestricted. Our investments in marketable securities included $187 million of investments in auction rate
securities at fair value ($411 million par value) that are classified as noncurrent assets on our consolidated balance sheets.
Investments in Marketable Securities
As of December 31, 2008, we held auction rate securities totaling $411 million at par value, which are classified as available for
sale securities and noncurrent assets on our consolidated balance sheets. Contractual
57