US Airways 2008 Annual Report Download - page 82
Download and view the complete annual report
Please find page 82 of the 2008 US Airways annual report below. You can navigate through the pages in the report by either clicking on the pages listed below, or by using the keyword search tool below to find specific information within the annual report.-
 1
1 -
2
-
3
-
4
-
5
-
6
-
7
-
8
-
9
-
10
-
11
-
12
-
13
-
14
-
15
-
16
-
17
-
18
-
19
-
20
-
21
-
22
-
23
-
24
-
25
-
26
-
27
-
28
-
29
-
30
-
31
-
32
-
33
-
34
-
35
-
36
-
37
-
38
-
39
-
40
-
41
-
42
-
43
-
44
-
45
-
46
-
47
-
48
-
49
-
50
-
51
-
52
-
53
-
54
-
55
-
56
-
57
-
58
-
59
-
60
-
61
-
62
-
63
-
64
-
65
-
66
-
67
-
68
-
69
-
70
-
71
-
 72
72 -
 73
73 -
 74
74 -
 75
75 -
 76
76 -
 77
77 -
 78
78 -
 79
79 -
 80
80 -
 81
81 -
 82
82 -
 83
83 -
 84
84 -
 85
85 -
 86
86 -
 87
87 -
 88
88 -
 89
89 -
 90
90 -
 91
91 -
 92
92 -
93
-
94
-
95
-
96
-
97
-
98
-
99
-
100
-
101
-
102
-
103
-
104
-
105
-
106
-
107
-
108
-
109
-
110
-
111
-
112
-
113
-
114
-
115
-
116
-
117
-
118
-
119
-
120
-
121
-
122
-
123
-
124
-
125
-
126
-
127
-
128
-
129
-
130
-
131
-
132
-
133
-
134
-
135
-
136
-
137
-
138
-
139
-
140
-
141
-
142
-
143
-
144
-
145
-
146
-
147
-
148
-
149
-
150
-
151
-
152
-
153
-
154
-
155
-
156
-
157
-
158
-
159
-
160
-
161
-
162
-
163
-
164
-
165
-
166
-
167
-
168
-
169
-
170
-
171
-
172
-
173
-
174
-
175
-
176
-
177
-
178
-
179
-
180
-
181
-
182
-
183
-
184
-
185
-
186
-
187
-
188
-
189
-
190
-
191
-
192
-
193
-
194
-
195
-
196
-
197
-
198
-
199
-
200
-
201
-
202
-
203
-
204
-
205
-
206
-
207
-
208
-
209
-
210
-
211
-
212
-
213
-
214
-
215
-
216
-
217
-
218
-
219
-
220
-
221
-
222
-
223
-
224
-
225
-
226
-
227
-
228
-
229
-
230
-
231
-
232
-
233
-
234
-
235
-
236
-
237
-
238
-
239
-
240
-
241
-
242
-
243
-
244
-
245
-
246
-
247
-
248
-
249
-
250
-
251
-
252
-
253
-
254
-
255
-
256
-
257
-
258
-
259
-
260
-
261
-
262
-
263
-
264
-
265
-
266
-
267
-
268
-
269
-
270
-
271
-
272
-
273
-
274
-
275
-
276
-
277
-
278
-
279
-
280
-
281
-
282
-
283
-
284
-
285
-
286
-
287
-
288
-
289
-
290
-
291
-
292
-
293
-
294
-
295
-
296
-
297
-
298
-
299
-
300
-
301
-
302
-
303
-
304
-
305
-
306
-
307
-
308
-
309
-
310
-
311
-
312
-
313
-
314
-
315
-
316
-
317
-
318
-
319
-
320
-
321
-
322
-
323
-
324
-
325
-
326
-
327
-
328
-
329
-
330
-
331
-
332
-
333
-
334
-
335
-
336
-
337
-
338
-
339
-
340
-
341
-
342
-
343
-
344
-
345
-
346
-
347
-
348
-
349
-
350
-
351
-
352
-
353
-
354
-
355
-
356
-
357
-
358
-
359
-
360
-
361
-
362
-
363
-
364
-
365
-
366
-
367
-
368
-
369
-
370
-
371
-
372
-
373
-
374
-
375
-
376
-
377
-
378
-
379
-
380
-
381
-
382
-
383
-
384
-
385
-
386
-
387
-
388
-
389
-
390
-
391
-
392
-
393
-
394
-
395
-
396
-
397
-
398
-
399
-
400
-
401
 |
 |

Table of Contents
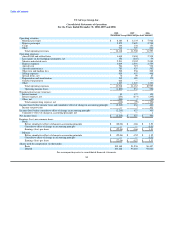
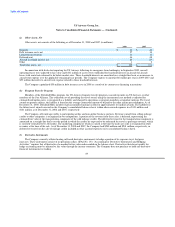
US Airways Group, Inc.
Consolidated Statements of Operations
For the Years Ended December 31, 2008, 2007 and 2006
2008 2007 2006
(In millions, except share and per share amounts)
Operating revenues:
Mainline passenger $ 8,183 $ 8,135 $ 7,966
Express passenger 2,879 2,698 2,744
Cargo 144 138 153
Other 912 729 694
Total operating revenues 12,118 11,700 11,557
Operating expenses:
Aircraft fuel and related taxes 3,618 2,630 2,518
Loss (gain) on fuel hedging instruments, net 356 (245) 79
Salaries and related costs 2,231 2,302 2,090
Express expenses 3,049 2,594 2,559
Aircraft rent 724 727 732
Aircraft maintenance 783 635 582
Other rent and landing fees 562 536 568
Selling expenses 439 453 446
Special items, net 76 99 27
Depreciation and amortization 215 189 175
Goodwill impairment 622 — —
Other 1,243 1,247 1,223
Total operating expenses 13,918 11,167 10,999
Operating income (loss) (1,800) 533 558
Nonoperating income (expense):
Interest income 83 172 153
Interest expense, net (253) (273) (295)
Other, net (240) 2 (12)
Total nonoperating expense, net (410) (99) (154)
Income (loss) before income taxes and cumulative effect of change in accounting principle (2,210) 434 404
Income tax provision — 7 101
Income (loss) before cumulative effect of change in accounting principle (2,210) 427 303
Cumulative effect of change in accounting principle, net — — 1
Net income (loss) $ (2,210) $ 427 $ 304
Earnings (loss) per common share:
Basic:
Before cumulative effect of change in accounting principle $ (22.06) $ 4.66 $ 3.50
Cumulative effect of change in accounting principle — — 0.01
Earnings (loss) per share $ (22.06) $ 4.66 $ 3.51
Diluted:
Before cumulative effect of change in accounting principle $ (22.06) $ 4.52 $ 3.32
Cumulative effect of change in accounting principle — — 0.01
Earnings (loss) per share $ (22.06) $ 4.52 $ 3.33
Shares used for computation (in thousands):
Basic 100,168 91,536 86,447
Diluted 100,168 95,603 93,821
See accompanying notes to consolidated financial statements.
80