US Airways 2008 Annual Report Download - page 40
Download and view the complete annual report
Please find page 40 of the 2008 US Airways annual report below. You can navigate through the pages in the report by either clicking on the pages listed below, or by using the keyword search tool below to find specific information within the annual report.-
 1
1 -
2
-
3
-
4
-
5
-
6
-
7
-
8
-
9
-
10
-
11
-
12
-
13
-
14
-
15
-
16
-
17
-
18
-
19
-
20
-
21
-
22
-
23
-
24
-
25
-
26
-
27
-
28
-
29
-
 30
30 -
 31
31 -
 32
32 -
 33
33 -
 34
34 -
 35
35 -
 36
36 -
 37
37 -
 38
38 -
 39
39 -
 40
40 -
 41
41 -
 42
42 -
 43
43 -
 44
44 -
 45
45 -
 46
46 -
 47
47 -
 48
48 -
 49
49 -
 50
50 -
51
-
52
-
53
-
54
-
55
-
56
-
57
-
58
-
59
-
60
-
61
-
62
-
63
-
64
-
65
-
66
-
67
-
68
-
69
-
70
-
71
-
72
-
73
-
74
-
75
-
76
-
77
-
78
-
79
-
80
-
81
-
82
-
83
-
84
-
85
-
86
-
87
-
88
-
89
-
90
-
91
-
92
-
93
-
94
-
95
-
96
-
97
-
98
-
99
-
100
-
101
-
102
-
103
-
104
-
105
-
106
-
107
-
108
-
109
-
110
-
111
-
112
-
113
-
114
-
115
-
116
-
117
-
118
-
119
-
120
-
121
-
122
-
123
-
124
-
125
-
126
-
127
-
128
-
129
-
130
-
131
-
132
-
133
-
134
-
135
-
136
-
137
-
138
-
139
-
140
-
141
-
142
-
143
-
144
-
145
-
146
-
147
-
148
-
149
-
150
-
151
-
152
-
153
-
154
-
155
-
156
-
157
-
158
-
159
-
160
-
161
-
162
-
163
-
164
-
165
-
166
-
167
-
168
-
169
-
170
-
171
-
172
-
173
-
174
-
175
-
176
-
177
-
178
-
179
-
180
-
181
-
182
-
183
-
184
-
185
-
186
-
187
-
188
-
189
-
190
-
191
-
192
-
193
-
194
-
195
-
196
-
197
-
198
-
199
-
200
-
201
-
202
-
203
-
204
-
205
-
206
-
207
-
208
-
209
-
210
-
211
-
212
-
213
-
214
-
215
-
216
-
217
-
218
-
219
-
220
-
221
-
222
-
223
-
224
-
225
-
226
-
227
-
228
-
229
-
230
-
231
-
232
-
233
-
234
-
235
-
236
-
237
-
238
-
239
-
240
-
241
-
242
-
243
-
244
-
245
-
246
-
247
-
248
-
249
-
250
-
251
-
252
-
253
-
254
-
255
-
256
-
257
-
258
-
259
-
260
-
261
-
262
-
263
-
264
-
265
-
266
-
267
-
268
-
269
-
270
-
271
-
272
-
273
-
274
-
275
-
276
-
277
-
278
-
279
-
280
-
281
-
282
-
283
-
284
-
285
-
286
-
287
-
288
-
289
-
290
-
291
-
292
-
293
-
294
-
295
-
296
-
297
-
298
-
299
-
300
-
301
-
302
-
303
-
304
-
305
-
306
-
307
-
308
-
309
-
310
-
311
-
312
-
313
-
314
-
315
-
316
-
317
-
318
-
319
-
320
-
321
-
322
-
323
-
324
-
325
-
326
-
327
-
328
-
329
-
330
-
331
-
332
-
333
-
334
-
335
-
336
-
337
-
338
-
339
-
340
-
341
-
342
-
343
-
344
-
345
-
346
-
347
-
348
-
349
-
350
-
351
-
352
-
353
-
354
-
355
-
356
-
357
-
358
-
359
-
360
-
361
-
362
-
363
-
364
-
365
-
366
-
367
-
368
-
369
-
370
-
371
-
372
-
373
-
374
-
375
-
376
-
377
-
378
-
379
-
380
-
381
-
382
-
383
-
384
-
385
-
386
-
387
-
388
-
389
-
390
-
391
-
392
-
393
-
394
-
395
-
396
-
397
-
398
-
399
-
400
-
401
 |
 |

Table of Contents
of call center/airport ticketing fees and increases to certain preexisting service fees. We anticipate that these new services and fees will
generate in excess of $400 million annually in additional revenue.
Cost Control
We remain committed to maintaining a low cost structure, which we believe is necessary in an industry whose economic prospects
are heavily dependent upon two variables we cannot control: the health of the economy and the price of fuel. As a result of our capacity
reductions and our commitment to exercise tight cost controls, the following cost initiatives were completed in 2008:
• Employee Reduction: As a result of the reduced flying, we required approximately 2,200 fewer positions across the system,
including approximately 300 pilots, 400 flight attendants, 800 airport employees and 700 non-union administrative management
and staff. These headcount reductions were implemented through a combination of voluntary and involuntary furloughs and
attrition.
• Reduced Capital Expenditures: We reduced our 2008 planned non-aircraft capital expenditures by $80 million, while maintaining
critical operational projects such as our Reliability, Convenience and Appearance ("RCA") initiative, which includes cabin
refurbishments, improved and additional check-in kiosks, airport club refurbishments, facility upgrades, new gate reading
technology and the completion of our next generation website.
• Closed Certain Facilities: The US Airways Club in the Baltimore/Washington International Airport, arrivals lounges in Munich,
Rome and Zurich, and cargo stations in Burbank, Colorado Springs and Reno were closed during 2008.
• Reduced Partner Costs: We have revised our wholesale programs for cruise lines, tour operators and consolidators, which
included the reduction of the number of agency partners, decreased discounts, tighter restrictions on travel rules, and a reduction
in commissions.
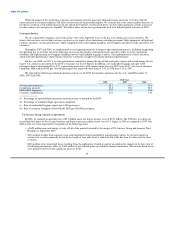
Most importantly, we controlled costs by running a good operation. We dramatically improved our on-time performance and
mishandled baggage ratio. For the year 2008, our 80.1% on-time performance ranked first among the big six hub and spoke carriers and
second among the ten largest U.S. airlines as measured by the DOT's Consumer Air Travel Report. See the "Customer Service" section
below for further discussion.
Liquidity
In 2008, we took the following actions to improve our liquidity position:
• In August 2008, we completed an underwritten public stock offering of 19 million common shares, as well as the full exercise of
2.85 million common shares included in an overallotment option, at an offering price of $8.50 per share. Net proceeds from the
offering, after underwriting discounts and commissions, were $179 million. We used the proceeds from the offering for general
corporate purposes.
• On October 20, 2008, we completed a series of financial transactions which raised approximately $810 million in gross proceeds
and included a $400 million paydown at par of our $1.6 billion credit facility administered by Citicorp North America. In
exchange for this prepayment, the unrestricted cash covenant contained in the Citicorp credit facility was reduced from
$1.25 billion to $850 million. The credit facility's term remained the same at seven years with substantially all of the remaining
principal amount payable at maturity in March 2014. Our net proceeds after transaction fees were approximately $370 million.
• On December 5, 2008, we prepaid $100 million of the indebtedness incurred in October 2008 related to a loan secured by certain
spare parts. On January 16, 2009, we exercised our right to obtain new loan commitments under the same agreement and raised
$50 million.
In addition, to plan for a highly cyclical and volatile industry, we had already refinanced $1.6 billion of debt during 2007. This
improved our liquidity by extending the due dates of principal payments.
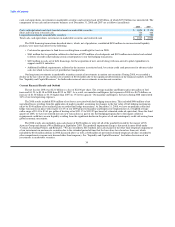
As of December 31, 2008, our cash, cash equivalents, investments in marketable securities and restricted cash were $1.97 billion, of
which $1.24 billion was unrestricted. This compares to December 31, 2007, when we had
38