US Airways 2008 Annual Report Download - page 70
Download and view the complete annual report
Please find page 70 of the 2008 US Airways annual report below. You can navigate through the pages in the report by either clicking on the pages listed below, or by using the keyword search tool below to find specific information within the annual report.-
 1
1 -
2
-
3
-
4
-
5
-
6
-
7
-
8
-
9
-
10
-
11
-
12
-
13
-
14
-
15
-
16
-
17
-
18
-
19
-
20
-
21
-
22
-
23
-
24
-
25
-
26
-
27
-
28
-
29
-
30
-
31
-
32
-
33
-
34
-
35
-
36
-
37
-
38
-
39
-
40
-
41
-
42
-
43
-
44
-
45
-
46
-
47
-
48
-
49
-
50
-
51
-
52
-
53
-
54
-
55
-
56
-
57
-
58
-
59
-
 60
60 -
 61
61 -
 62
62 -
 63
63 -
 64
64 -
 65
65 -
 66
66 -
 67
67 -
 68
68 -
 69
69 -
 70
70 -
 71
71 -
 72
72 -
 73
73 -
 74
74 -
 75
75 -
 76
76 -
 77
77 -
 78
78 -
 79
79 -
 80
80 -
81
-
82
-
83
-
84
-
85
-
86
-
87
-
88
-
89
-
90
-
91
-
92
-
93
-
94
-
95
-
96
-
97
-
98
-
99
-
100
-
101
-
102
-
103
-
104
-
105
-
106
-
107
-
108
-
109
-
110
-
111
-
112
-
113
-
114
-
115
-
116
-
117
-
118
-
119
-
120
-
121
-
122
-
123
-
124
-
125
-
126
-
127
-
128
-
129
-
130
-
131
-
132
-
133
-
134
-
135
-
136
-
137
-
138
-
139
-
140
-
141
-
142
-
143
-
144
-
145
-
146
-
147
-
148
-
149
-
150
-
151
-
152
-
153
-
154
-
155
-
156
-
157
-
158
-
159
-
160
-
161
-
162
-
163
-
164
-
165
-
166
-
167
-
168
-
169
-
170
-
171
-
172
-
173
-
174
-
175
-
176
-
177
-
178
-
179
-
180
-
181
-
182
-
183
-
184
-
185
-
186
-
187
-
188
-
189
-
190
-
191
-
192
-
193
-
194
-
195
-
196
-
197
-
198
-
199
-
200
-
201
-
202
-
203
-
204
-
205
-
206
-
207
-
208
-
209
-
210
-
211
-
212
-
213
-
214
-
215
-
216
-
217
-
218
-
219
-
220
-
221
-
222
-
223
-
224
-
225
-
226
-
227
-
228
-
229
-
230
-
231
-
232
-
233
-
234
-
235
-
236
-
237
-
238
-
239
-
240
-
241
-
242
-
243
-
244
-
245
-
246
-
247
-
248
-
249
-
250
-
251
-
252
-
253
-
254
-
255
-
256
-
257
-
258
-
259
-
260
-
261
-
262
-
263
-
264
-
265
-
266
-
267
-
268
-
269
-
270
-
271
-
272
-
273
-
274
-
275
-
276
-
277
-
278
-
279
-
280
-
281
-
282
-
283
-
284
-
285
-
286
-
287
-
288
-
289
-
290
-
291
-
292
-
293
-
294
-
295
-
296
-
297
-
298
-
299
-
300
-
301
-
302
-
303
-
304
-
305
-
306
-
307
-
308
-
309
-
310
-
311
-
312
-
313
-
314
-
315
-
316
-
317
-
318
-
319
-
320
-
321
-
322
-
323
-
324
-
325
-
326
-
327
-
328
-
329
-
330
-
331
-
332
-
333
-
334
-
335
-
336
-
337
-
338
-
339
-
340
-
341
-
342
-
343
-
344
-
345
-
346
-
347
-
348
-
349
-
350
-
351
-
352
-
353
-
354
-
355
-
356
-
357
-
358
-
359
-
360
-
361
-
362
-
363
-
364
-
365
-
366
-
367
-
368
-
369
-
370
-
371
-
372
-
373
-
374
-
375
-
376
-
377
-
378
-
379
-
380
-
381
-
382
-
383
-
384
-
385
-
386
-
387
-
388
-
389
-
390
-
391
-
392
-
393
-
394
-
395
-
396
-
397
-
398
-
399
-
400
-
401
 |
 |
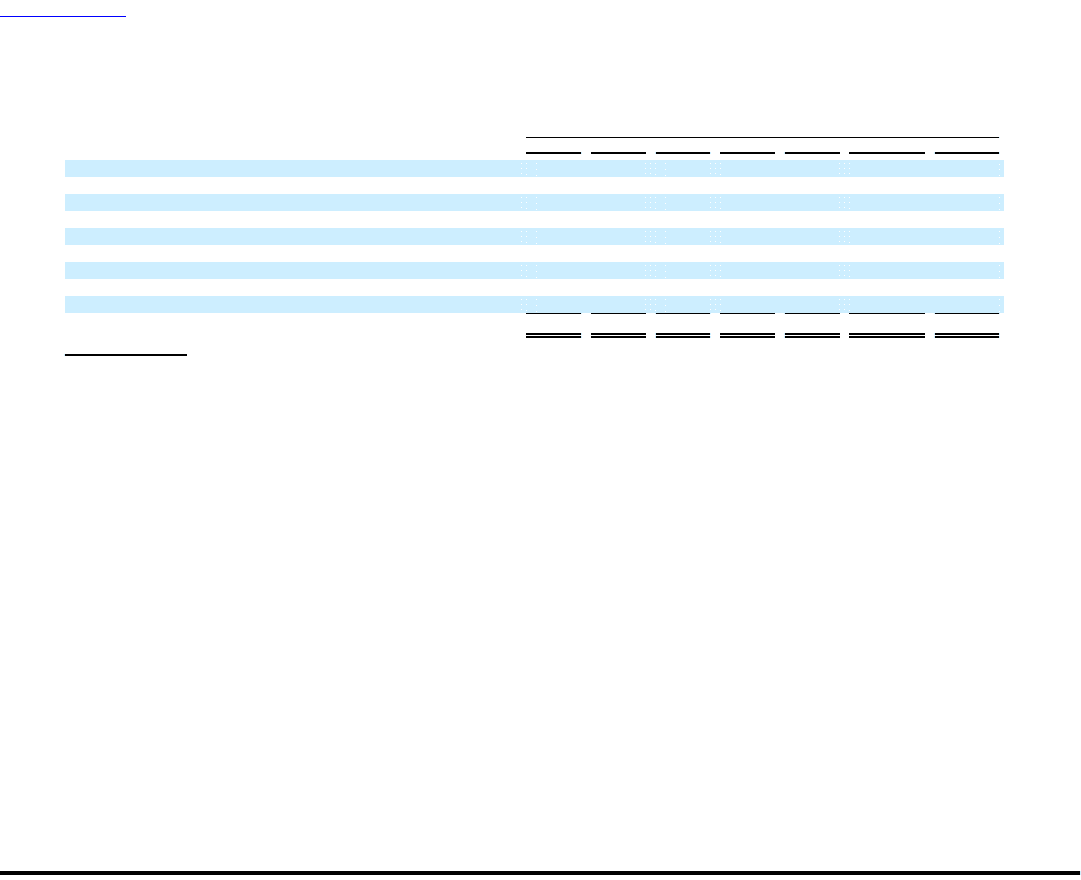
Table of Contents
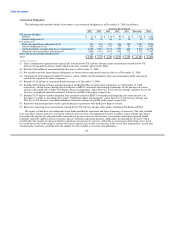
Contractual Obligations
The following table provides details of our future cash contractual obligations as of December 31, 2008 (in millions):
Payments Due by Period
2009 2010 2011 2012 2013 Thereafter Total
US Airways Group(1)
Debt(2) $ 16 $ 33 $ 116 $ 99 $ 16 $ 1,178 $ 1,458
Interest obligations(3) 50 50 46 41 38 50 275
US Airways(4)
Debt and capital lease obligations(5)(6) 356 221 257 246 192 1,423 2,695
Interest obligations(3)(6) 146 148 157 129 87 415 1,082
Aircraft purchase and operating lease commitments(7) 2,408 2,312 2,138 1,537 664 5,315 14,374
Regional capacity purchase agreements(8) 1,008 1,013 1,031 902 731 2,712 7,397
Other US Airways Group subsidiaries(9) 10 2 1 1 1 — 15
Total $ 3,994 $ 3,779 $ 3,746 $ 2,955 $ 1,729 $ 11,093 $ 27,296
(1) These commitments represent those specifically entered into by US Airways Group or joint commitments entered into by US
Airways Group and US Airways under which each entity is jointly and severally liable.
(2) Excludes $44 million of unamortized debt discount as of December 31, 2008.
(3) For variable-rate debt, future interest obligations are shown above using interest rates in effect as of December 31, 2008.
(4) Commitments listed separately under US Airways and its wholly owned subsidiaries represent commitments under agreements
entered into separately by those companies.
(5) Excludes $113 million of unamortized debt discount as of December 31, 2008.
(6) Includes $540 million of future principal payments and $260 million of future interest payments as of December 31, 2008,
respectively, related to pass through trust certificates or EETCs associated with mortgage financings for the purchase of certain
aircraft as described above under "Off-Balance Sheet Arrangements" and in Note 9(c) to US Airways Group's and Note 8(c) to US
Airways' consolidated financial statements in Item 8A and 8B of this report, respectively.
(7) Includes $3.57 billion of future minimum lease payments related to EETC leveraged leased financings of certain aircraft as of
December 31, 2008, as described above under "Off-Balance Sheet Arrangements" and in Note 9(c) to US Airways Group's and
Note 8(c) to US Airways' consolidated financial statements in Item 8A and 8B of this report, respectively.
(8) Represents minimum payments under capacity purchase agreements with third-party Express carriers.
(9) Represents operating lease commitments entered into by US Airways Group's other airline subsidiaries Piedmont and PSA.
We expect to fund these cash obligations from funds provided by operations and future financings, if necessary. The cash available
to us from these sources, however, may not be sufficient to cover these cash obligations because economic factors outside our control
may reduce the amount of cash generated by operations or increase our costs. For instance, an economic downturn or general global
instability caused by military actions, terrorism, disease outbreaks and natural disasters could reduce the demand for air travel, which
would reduce the amount of cash generated by operations. An increase in our costs, either due to an increase in borrowing costs caused
by a reduction in our credit rating or a general increase in interest rates or due to an increase in the cost of fuel, maintenance, aircraft and
aircraft engines and parts, could decrease the amount of cash available to cover the cash obligations.
68