US Airways 2008 Annual Report Download - page 41
Download and view the complete annual report
Please find page 41 of the 2008 US Airways annual report below. You can navigate through the pages in the report by either clicking on the pages listed below, or by using the keyword search tool below to find specific information within the annual report.-
 1
1 -
2
-
3
-
4
-
5
-
6
-
7
-
8
-
9
-
10
-
11
-
12
-
13
-
14
-
15
-
16
-
17
-
18
-
19
-
20
-
21
-
22
-
23
-
24
-
25
-
26
-
27
-
28
-
29
-
30
-
 31
31 -
 32
32 -
 33
33 -
 34
34 -
 35
35 -
 36
36 -
 37
37 -
 38
38 -
 39
39 -
 40
40 -
 41
41 -
 42
42 -
 43
43 -
 44
44 -
 45
45 -
 46
46 -
 47
47 -
 48
48 -
 49
49 -
 50
50 -
 51
51 -
52
-
53
-
54
-
55
-
56
-
57
-
58
-
59
-
60
-
61
-
62
-
63
-
64
-
65
-
66
-
67
-
68
-
69
-
70
-
71
-
72
-
73
-
74
-
75
-
76
-
77
-
78
-
79
-
80
-
81
-
82
-
83
-
84
-
85
-
86
-
87
-
88
-
89
-
90
-
91
-
92
-
93
-
94
-
95
-
96
-
97
-
98
-
99
-
100
-
101
-
102
-
103
-
104
-
105
-
106
-
107
-
108
-
109
-
110
-
111
-
112
-
113
-
114
-
115
-
116
-
117
-
118
-
119
-
120
-
121
-
122
-
123
-
124
-
125
-
126
-
127
-
128
-
129
-
130
-
131
-
132
-
133
-
134
-
135
-
136
-
137
-
138
-
139
-
140
-
141
-
142
-
143
-
144
-
145
-
146
-
147
-
148
-
149
-
150
-
151
-
152
-
153
-
154
-
155
-
156
-
157
-
158
-
159
-
160
-
161
-
162
-
163
-
164
-
165
-
166
-
167
-
168
-
169
-
170
-
171
-
172
-
173
-
174
-
175
-
176
-
177
-
178
-
179
-
180
-
181
-
182
-
183
-
184
-
185
-
186
-
187
-
188
-
189
-
190
-
191
-
192
-
193
-
194
-
195
-
196
-
197
-
198
-
199
-
200
-
201
-
202
-
203
-
204
-
205
-
206
-
207
-
208
-
209
-
210
-
211
-
212
-
213
-
214
-
215
-
216
-
217
-
218
-
219
-
220
-
221
-
222
-
223
-
224
-
225
-
226
-
227
-
228
-
229
-
230
-
231
-
232
-
233
-
234
-
235
-
236
-
237
-
238
-
239
-
240
-
241
-
242
-
243
-
244
-
245
-
246
-
247
-
248
-
249
-
250
-
251
-
252
-
253
-
254
-
255
-
256
-
257
-
258
-
259
-
260
-
261
-
262
-
263
-
264
-
265
-
266
-
267
-
268
-
269
-
270
-
271
-
272
-
273
-
274
-
275
-
276
-
277
-
278
-
279
-
280
-
281
-
282
-
283
-
284
-
285
-
286
-
287
-
288
-
289
-
290
-
291
-
292
-
293
-
294
-
295
-
296
-
297
-
298
-
299
-
300
-
301
-
302
-
303
-
304
-
305
-
306
-
307
-
308
-
309
-
310
-
311
-
312
-
313
-
314
-
315
-
316
-
317
-
318
-
319
-
320
-
321
-
322
-
323
-
324
-
325
-
326
-
327
-
328
-
329
-
330
-
331
-
332
-
333
-
334
-
335
-
336
-
337
-
338
-
339
-
340
-
341
-
342
-
343
-
344
-
345
-
346
-
347
-
348
-
349
-
350
-
351
-
352
-
353
-
354
-
355
-
356
-
357
-
358
-
359
-
360
-
361
-
362
-
363
-
364
-
365
-
366
-
367
-
368
-
369
-
370
-
371
-
372
-
373
-
374
-
375
-
376
-
377
-
378
-
379
-
380
-
381
-
382
-
383
-
384
-
385
-
386
-
387
-
388
-
389
-
390
-
391
-
392
-
393
-
394
-
395
-
396
-
397
-
398
-
399
-
400
-
401
 |
 |

Table of Contents
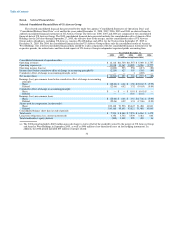
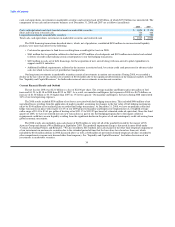
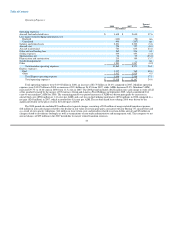
cash, cash equivalents, investments in marketable securities and restricted cash of $3 billion, of which $2.53 billion was unrestricted. The
components of our cash and investments balances as of December 31, 2008 and 2007 are as follows (in millions):
2008 2007
Cash, cash equivalents and short-term investments in marketable securities $ 1,054 $ 2,174
Short and long-term restricted cash 726 468
Long-term investments in marketable securities 187 353
Total cash, cash equivalents, investments in marketable securities and restricted cash $ 1,967 $ 2,995
The 2008 financing transactions described above, which, net of paydowns, contributed $450 million to our unrestricted liquidity
position, were more than offset by the following:
• Cash used in operations to fund losses resulting from record high fuel costs in 2008.
• $461 million that we posted in collateral in the form of $276 million of cash deposits and $185 million in restricted cash related
to letters of credit collateralizing certain counterparties to our fuel hedging transactions.
• $430 million in cash, net of debt financings, for the acquisition of new aircraft along with non-aircraft capital expenditures to
support our RCA initiatives.
• Additional holdback requirements, reflected in the increase in restricted cash, by certain credit card processors for advance ticket
sales for which we have not yet provided air transportation.
Our long-term investments in marketable securities consist of investments in auction rate securities. During 2008, we recorded a
decline in the fair value of our auction rate securities of $166 million due to the significant deterioration in the financial markets in 2008.
See "Liquidity and Capital Resources" for further discussion of our investments in auction rate securities.
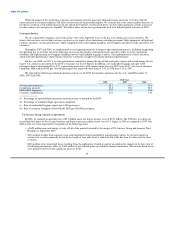
Current Financial Results and Outlook
The net loss for 2008 was $2.21 billion or a loss of $22.06 per share. The average mainline and Express price per gallon of fuel
increased 44.1% to $3.18 in 2008 from $2.21 in 2007. As a result, our mainline and Express fuel expense in 2008 was $4.76 billion, an
increase of $1.36 billion or 40.1% higher than 2007 on 1% lower capacity. Our mainline and Express fuel costs during 2008 represented
34% of our total operating expenses.
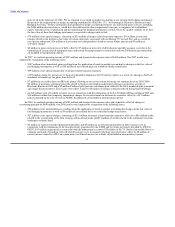
The 2008 results included $356 million of net losses associated with fuel hedging transactions. This included $496 million of net
unrealized losses resulting from the application of mark-to-market accounting for changes in the fair value of fuel hedging instruments,
offset by $140 million of net realized gains on settled fuel hedge transactions. At December 31, 2008, we have no premium collar fuel
hedge transactions in place with respect to 14% of our 2009 projected mainline and Express fuel requirements at a weighted average
collar range of $3.41 to $3.61 per gallon of heating oil or $131.15 to $139.55 per barrel of estimated crude oil equivalent. Since the third
quarter of 2008, we have not entered into any new transactions as part of our fuel hedging program due to the impact collateral
requirements could have on our liquidity resulting from the significant decline in the price of oil and counterparty credit risk arising from
global economic uncertainty.
The 2008 results also included a non-cash charge of $622 million to write off all of the goodwill created by the merger of US
Airways Group and America West Holdings in September 2005. The goodwill impairment charge is discussed in more detail under
"Critical Accounting Policies and Estimates." We also recorded a $214 million non-cash charge for the other than temporary impairment
of our investments in auction rate securities due to the extended period of time that the fair values have been less than cost, which
included the $166 million decline in 2008 discussed above as well as $48 million of previously deemed temporary declines recorded to
other comprehensive income now deemed other than temporary. See "Liquidity and Capital Resources" for further discussion of our
investments in marketable securities.
39