US Airways 2008 Annual Report Download - page 131
Download and view the complete annual report
Please find page 131 of the 2008 US Airways annual report below. You can navigate through the pages in the report by either clicking on the pages listed below, or by using the keyword search tool below to find specific information within the annual report.-
 1
1 -
2
-
3
-
4
-
5
-
6
-
7
-
8
-
9
-
10
-
11
-
12
-
13
-
14
-
15
-
16
-
17
-
18
-
19
-
20
-
21
-
22
-
23
-
24
-
25
-
26
-
27
-
28
-
29
-
30
-
31
-
32
-
33
-
34
-
35
-
36
-
37
-
38
-
39
-
40
-
41
-
42
-
43
-
44
-
45
-
46
-
47
-
48
-
49
-
50
-
51
-
52
-
53
-
54
-
55
-
56
-
57
-
58
-
59
-
60
-
61
-
62
-
63
-
64
-
65
-
66
-
67
-
68
-
69
-
70
-
71
-
72
-
73
-
74
-
75
-
76
-
77
-
78
-
79
-
80
-
81
-
82
-
83
-
84
-
85
-
86
-
87
-
88
-
89
-
90
-
91
-
92
-
93
-
94
-
95
-
96
-
97
-
98
-
99
-
100
-
101
-
102
-
103
-
104
-
105
-
106
-
107
-
108
-
109
-
110
-
111
-
112
-
113
-
114
-
115
-
116
-
117
-
118
-
119
-
120
-
 121
121 -
 122
122 -
 123
123 -
 124
124 -
 125
125 -
 126
126 -
 127
127 -
 128
128 -
 129
129 -
 130
130 -
 131
131 -
 132
132 -
 133
133 -
 134
134 -
 135
135 -
 136
136 -
 137
137 -
 138
138 -
 139
139 -
 140
140 -
 141
141 -
142
-
143
-
144
-
145
-
146
-
147
-
148
-
149
-
150
-
151
-
152
-
153
-
154
-
155
-
156
-
157
-
158
-
159
-
160
-
161
-
162
-
163
-
164
-
165
-
166
-
167
-
168
-
169
-
170
-
171
-
172
-
173
-
174
-
175
-
176
-
177
-
178
-
179
-
180
-
181
-
182
-
183
-
184
-
185
-
186
-
187
-
188
-
189
-
190
-
191
-
192
-
193
-
194
-
195
-
196
-
197
-
198
-
199
-
200
-
201
-
202
-
203
-
204
-
205
-
206
-
207
-
208
-
209
-
210
-
211
-
212
-
213
-
214
-
215
-
216
-
217
-
218
-
219
-
220
-
221
-
222
-
223
-
224
-
225
-
226
-
227
-
228
-
229
-
230
-
231
-
232
-
233
-
234
-
235
-
236
-
237
-
238
-
239
-
240
-
241
-
242
-
243
-
244
-
245
-
246
-
247
-
248
-
249
-
250
-
251
-
252
-
253
-
254
-
255
-
256
-
257
-
258
-
259
-
260
-
261
-
262
-
263
-
264
-
265
-
266
-
267
-
268
-
269
-
270
-
271
-
272
-
273
-
274
-
275
-
276
-
277
-
278
-
279
-
280
-
281
-
282
-
283
-
284
-
285
-
286
-
287
-
288
-
289
-
290
-
291
-
292
-
293
-
294
-
295
-
296
-
297
-
298
-
299
-
300
-
301
-
302
-
303
-
304
-
305
-
306
-
307
-
308
-
309
-
310
-
311
-
312
-
313
-
314
-
315
-
316
-
317
-
318
-
319
-
320
-
321
-
322
-
323
-
324
-
325
-
326
-
327
-
328
-
329
-
330
-
331
-
332
-
333
-
334
-
335
-
336
-
337
-
338
-
339
-
340
-
341
-
342
-
343
-
344
-
345
-
346
-
347
-
348
-
349
-
350
-
351
-
352
-
353
-
354
-
355
-
356
-
357
-
358
-
359
-
360
-
361
-
362
-
363
-
364
-
365
-
366
-
367
-
368
-
369
-
370
-
371
-
372
-
373
-
374
-
375
-
376
-
377
-
378
-
379
-
380
-
381
-
382
-
383
-
384
-
385
-
386
-
387
-
388
-
389
-
390
-
391
-
392
-
393
-
394
-
395
-
396
-
397
-
398
-
399
-
400
-
401
 |
 |

Table of Contents
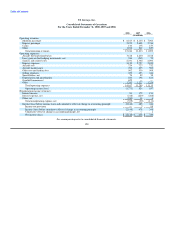
US Airways, Inc.
Consolidated Balance Sheets
December 31, 2008 and 2007
2008 2007
(In millions, except share and per share amounts)
ASSETS
Current assets
Cash and cash equivalents $ 1,026 $ 1,940
Investments in marketable securities 20 226
Restricted cash 186 2
Accounts receivable, net 291 366
Materials and supplies, net 163 197
Prepaid expenses and other 673 524
Total current assets 2,359 3,255
Property and equipment
Flight equipment 3,017 2,295
Ground property and equipment 791 681
Less accumulated depreciation and amortization (914) (729)
2,894 2,247
Equipment purchase deposits 267 128
Total property and equipment 3,161 2,375
Other assets
Other intangibles, net of accumulated amortization of $81 million and $58 million,
respectively 508 514
Restricted cash 540 466
Investments in marketable securities 187 353
Goodwill — 622
Other assets, net 199 202
Total other assets 1,434 2,157
Total assets $ 6,954 $ 7,787
LIABILITIES & STOCKHOLDER'S EQUITY (DEFICIT)
Current liabilities
Current maturities of debt and capital leases $ 346 $ 101
Accounts payable 781 333
Payables to related parties, net 985 1,067
Air traffic liability 698 832
Accrued compensation and vacation 147 214
Accrued taxes 142 158
Other accrued expenses 867 841
Total current liabilities 3,966 3,546
Noncurrent liabilities and deferred credits
Long-term debt and capital leases, net of current maturities 2,236 1,373
Deferred gains and credits, net 284 318
Postretirement benefits other than pensions 107 137
Employee benefit liabilities and other 582 563
Total noncurrent liabilities and deferred credits 3,209 2,391
Commitments and contingencies (Note 8)
Stockholder's equity (deficit)
Common stock, $1 par value, 1,000 shares issued and outstanding — —
Additional paid-in capital 1,845 1,845
Accumulated other comprehensive income (loss) 78 (1)
Retained earnings (deficit) (2,144) 6
Total stockholder's equity (deficit) (221) 1,850
Total liabilities and stockholder's equity (deficit) $ 6,954 $ 7,787
See accompanying notes to consolidated financial statements.
129