Time Magazine 2010 Annual Report Download - page 90
Download and view the complete annual report
Please find page 90 of the 2010 Time Magazine annual report below. You can navigate through the pages in the report by either clicking on the pages listed below, or by using the keyword search tool below to find specific information within the annual report.-
 1
1 -
2
-
3
-
4
-
5
-
6
-
7
-
8
-
9
-
10
-
11
-
12
-
13
-
14
-
15
-
16
-
17
-
18
-
19
-
20
-
21
-
22
-
23
-
24
-
25
-
26
-
27
-
28
-
29
-
30
-
31
-
32
-
33
-
34
-
35
-
36
-
37
-
38
-
39
-
40
-
41
-
42
-
43
-
44
-
45
-
46
-
47
-
48
-
49
-
50
-
51
-
52
-
53
-
54
-
55
-
56
-
57
-
58
-
59
-
60
-
61
-
62
-
63
-
64
-
65
-
66
-
67
-
68
-
69
-
70
-
71
-
72
-
73
-
74
-
75
-
76
-
77
-
78
-
79
-
 80
80 -
 81
81 -
 82
82 -
 83
83 -
 84
84 -
 85
85 -
 86
86 -
 87
87 -
 88
88 -
 89
89 -
 90
90 -
 91
91 -
 92
92 -
 93
93 -
 94
94 -
 95
95 -
 96
96 -
 97
97 -
 98
98 -
 99
99 -
 100
100 -
101
-
102
-
103
-
104
-
105
-
106
-
107
-
108
-
109
-
110
-
111
-
112
-
113
-
114
-
115
-
116
-
117
-
118
-
119
-
120
-
121
-
122
-
123
-
124
-
125
-
126
-
127
-
128
-
129
-
130
 |
 |

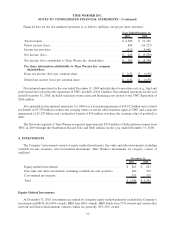
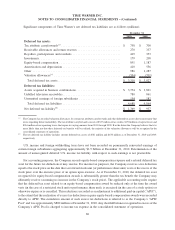
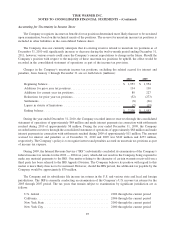
The following table reconciles the beginning and ending balances of assets and liabilities classified as Level 3
and identifies the net income (losses) the Company recognized during the years ended December 31, 2010 and
December 31, 2009, respectively, on such assets and liabilities that were included in the balance as of December 31,
2010 and December 31, 2009, respectively (millions):
2010 2009
Derivatives
Balance as of the beginning of the year ................................. $ 20 $ (11)
Total gains (losses):
Included in operating income ....................................... 17 —
Included in other income (loss), net .................................. 16 19
Included in other comprehensive income .............................. — —
Settlements ...................................................... (7) (4)
Issuances ....................................................... (55) 16
Transfers in and/or out of Level 3 ..................................... — —
Balance as of end of the year ........................................ $ (9) $ 20
Total gain (loss) for the year included in net income related to assets and liabilities
still held as of the end of the year ................................... $ 18 $ 19
Other Financial Instruments
The Company’s other financial instruments, including debt, are not required to be carried at fair value. Based on
the interest rates prevailing at December 31, 2010, the fair value of Time Warner’s debt exceeded its carrying value
by approximately $2.269 billion and, at December 31, 2009, the fair value of Time Warner’s debt exceeded its
carrying value by approximately $1.749 billion. Unrealized gains or losses on debt do not result in the realization or
expenditure of cash and generally are not recognized in the consolidated financial statements unless the debt is
retired prior to its maturity. The carrying value for the majority of the Company’s other financial instruments
approximates fair value due to the short-term nature of the financial instruments or because the financial
instruments are of a longer-term nature and are recorded on a discounted basis. For the remainder of the
Company’s other financial instruments, differences between the carrying value and fair value are not
significant at December 31, 2010. The fair value of financial instruments is generally determined by reference
to the market value of the instrument as quoted on a national securities exchange or an over-the-counter market. In
cases where a quoted market value is not available, fair value is based on an estimate using present value or other
valuation techniques.
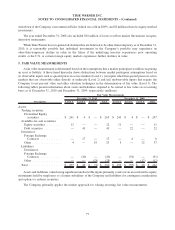
Non-Financial Instruments
The majority of the Company’s non-financial instruments, which include goodwill, intangible assets,
inventories and property, plant and equipment, are not required to be carried at fair value on a recurring basis.
However, if certain triggering events occur (or at least annually for goodwill and indefinite-lived intangible assets)
such that a non-financial instrument is required to be evaluated for impairment, a resulting asset impairment would
require that the non-financial instrument be recorded at the lower of cost or its fair value.
In determining the fair value of its films, the Company employs a discounted cash flow (“DCF”) methodology
with assumptions for cash flows for periods not exceeding 10 years. Key inputs employed in the DCF methodology
include estimates of a film’s ultimate revenue and costs as well as a discount rate. The discount rate utilized in the
DCF analysis is based on the weighted average cost of capital of the respective business (e.g., Warner Bros.) plus a
risk premium representing the risk associated with producing a particular film. The fair value of any film costs
associated with a film that management plans to abandon is zero. As the primary determination of fair value is
78
TIME WARNER INC.
NOTES TO CONSOLIDATED FINANCIAL STATEMENTS – (Continued)