Time Magazine 2010 Annual Report Download - page 113
Download and view the complete annual report
Please find page 113 of the 2010 Time Magazine annual report below. You can navigate through the pages in the report by either clicking on the pages listed below, or by using the keyword search tool below to find specific information within the annual report.-
 1
1 -
2
-
3
-
4
-
5
-
6
-
7
-
8
-
9
-
10
-
11
-
12
-
13
-
14
-
15
-
16
-
17
-
18
-
19
-
20
-
21
-
22
-
23
-
24
-
25
-
26
-
27
-
28
-
29
-
30
-
31
-
32
-
33
-
34
-
35
-
36
-
37
-
38
-
39
-
40
-
41
-
42
-
43
-
44
-
45
-
46
-
47
-
48
-
49
-
50
-
51
-
52
-
53
-
54
-
55
-
56
-
57
-
58
-
59
-
60
-
61
-
62
-
63
-
64
-
65
-
66
-
67
-
68
-
69
-
70
-
71
-
72
-
73
-
74
-
75
-
76
-
77
-
78
-
79
-
80
-
81
-
82
-
83
-
84
-
85
-
86
-
87
-
88
-
89
-
90
-
91
-
92
-
93
-
94
-
95
-
96
-
97
-
98
-
99
-
100
-
101
-
102
-
 103
103 -
 104
104 -
 105
105 -
 106
106 -
 107
107 -
 108
108 -
 109
109 -
 110
110 -
 111
111 -
 112
112 -
 113
113 -
 114
114 -
 115
115 -
 116
116 -
 117
117 -
 118
118 -
 119
119 -
 120
120 -
 121
121 -
 122
122 -
 123
123 -
124
-
125
-
126
-
127
-
128
-
129
-
130
 |
 |

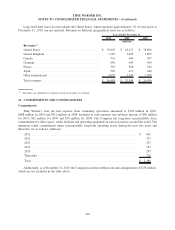
2010 2009 2008
Years Ended December 31,
(millions)
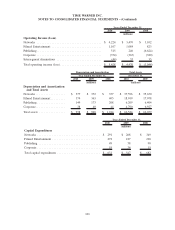
Operating Income (Loss)
Networks ....................................... $ 4,224 $ 3,470 $ 3,102
Filmed Entertainment .............................. 1,107 1,084 823
Publishing ....................................... 515 246 (6,624)
Corporate ....................................... (374) (365) (380)
Intersegment eliminations ........................... (44) 35 35
Total operating income (loss) ......................... $ 5,428 $ 4,470 $ (3,044)
2010 2009 2008 2010 2009
Year Ended December 31, December 31,
Depreciation and Amortization Total Assets
(millions) (millions)
Depreciation and Amortization
and Total Assets
Networks .................. $ 377 $ 372 $ 357 $ 37,596 $ 35,650
Filmed Entertainment ......... 374 363 405 18,019 17,078
Publishing ................. 149 173 208 6,209 6,404
Corporate.................. 38 40 44 4,700 6,927
Total assets ................ $ 938 $ 948 $ 1,014 $ 66,524 $ 66,059
2010 2009 2008
Years Ended December 31,
(millions)
Capital Expenditures
Networks ...................................... $ 291 $ 268 $ 349
Filmed Entertainment ............................. 272 187 228
Publishing ..................................... 49 58 90
Corporate ...................................... 19 34 15
Total capital expenditures .......................... $ 631 $ 547 $ 682
101
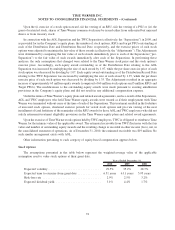
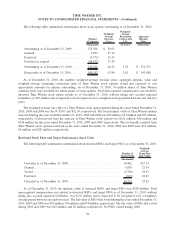
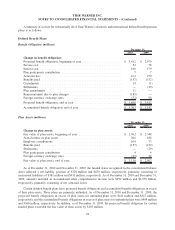
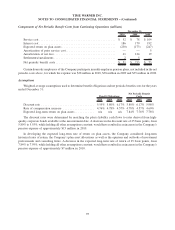
TIME WARNER INC.
NOTES TO CONSOLIDATED FINANCIAL STATEMENTS – (Continued)