Time Magazine 2010 Annual Report Download - page 112
Download and view the complete annual report
Please find page 112 of the 2010 Time Magazine annual report below. You can navigate through the pages in the report by either clicking on the pages listed below, or by using the keyword search tool below to find specific information within the annual report.-
 1
1 -
2
-
3
-
4
-
5
-
6
-
7
-
8
-
9
-
10
-
11
-
12
-
13
-
14
-
15
-
16
-
17
-
18
-
19
-
20
-
21
-
22
-
23
-
24
-
25
-
26
-
27
-
28
-
29
-
30
-
31
-
32
-
33
-
34
-
35
-
36
-
37
-
38
-
39
-
40
-
41
-
42
-
43
-
44
-
45
-
46
-
47
-
48
-
49
-
50
-
51
-
52
-
53
-
54
-
55
-
56
-
57
-
58
-
59
-
60
-
61
-
62
-
63
-
64
-
65
-
66
-
67
-
68
-
69
-
70
-
71
-
72
-
73
-
74
-
75
-
76
-
77
-
78
-
79
-
80
-
81
-
82
-
83
-
84
-
85
-
86
-
87
-
88
-
89
-
90
-
91
-
92
-
93
-
94
-
95
-
96
-
97
-
98
-
99
-
100
-
101
-
 102
102 -
 103
103 -
 104
104 -
 105
105 -
 106
106 -
 107
107 -
 108
108 -
 109
109 -
 110
110 -
 111
111 -
 112
112 -
 113
113 -
 114
114 -
 115
115 -
 116
116 -
 117
117 -
 118
118 -
 119
119 -
 120
120 -
 121
121 -
 122
122 -
123
-
124
-
125
-
126
-
127
-
128
-
129
-
130
 |
 |

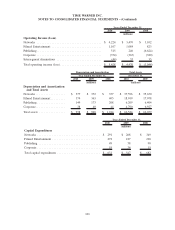
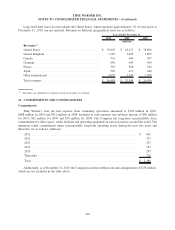
15. SEGMENT INFORMATION
Time Warner classifies its operations into three reportable segments: Networks, consisting principally of cable
television networks that provide programming; Filmed Entertainment, consisting principally of feature film,
television, home video and interactive videogame production and distribution; and Publishing, consisting
principally of magazine publishing.
Information as to the revenues, intersegment revenues, operating income (loss) and assets of Time Warner in
each of its reportable segments is set forth below.
Subscription Advertising Content Other Total
Year Ended December 31, 2010
(millions)
Revenues
Networks ..................... $ 7,671 $ 3,736 $ 942 $ 131 $ 12,480
Filmed Entertainment ............ 66 75 11,359 122 11,622
Publishing .................... 1,291 1,935 68 381 3,675
Intersegment eliminations ......... — (64) (804) (21) (889)
Total revenues ................. $ 9,028 $ 5,682 $ 11,565 $ 613 $ 26,888
Subscription Advertising Content Other Total
Year Ended December 31, 2009
(millions)
Revenues
Networks ..................... $ 7,077 $ 3,272 $ 819 $ 85 $ 11,253
Filmed Entertainment ............ 44 79 10,766 177 11,066
Publishing .................... 1,324 1,878 73 461 3,736
Intersegment eliminations ......... — (68) (584) (15) (667)
Total revenues ................. $ 8,445 $ 5,161 $ 11,074 $ 708 $ 25,388
Subscription Advertising Content Other Total
Year Ended December 31, 2008
(millions)
Revenues
Networks ..................... $ 6,738 $ 3,359 $ 901 $ 60 $ 11,058
Filmed Entertainment ............ 39 88 11,030 241 11,398
Publishing .................... 1,523 2,419 63 603 4,608
Intersegment eliminations ......... — (68) (544) (18) (630)
Total revenues ................. $ 8,300 $ 5,798 $ 11,450 $ 886 $ 26,434
2010 2009 2008
Years Ended December 31,
(millions)
Intersegment Revenues
Networks ......................................... $ 89 $ 89 $ 96
Filmed Entertainment ................................ 778 565 520
Publishing ........................................ 22 13 14
Total intersegment revenues ........................... $ 889 $ 667 $ 630
100
TIME WARNER INC.
NOTES TO CONSOLIDATED FINANCIAL STATEMENTS – (Continued)