Time Magazine 2010 Annual Report Download - page 88
Download and view the complete annual report
Please find page 88 of the 2010 Time Magazine annual report below. You can navigate through the pages in the report by either clicking on the pages listed below, or by using the keyword search tool below to find specific information within the annual report.-
 1
1 -
2
-
3
-
4
-
5
-
6
-
7
-
8
-
9
-
10
-
11
-
12
-
13
-
14
-
15
-
16
-
17
-
18
-
19
-
20
-
21
-
22
-
23
-
24
-
25
-
26
-
27
-
28
-
29
-
30
-
31
-
32
-
33
-
34
-
35
-
36
-
37
-
38
-
39
-
40
-
41
-
42
-
43
-
44
-
45
-
46
-
47
-
48
-
49
-
50
-
51
-
52
-
53
-
54
-
55
-
56
-
57
-
58
-
59
-
60
-
61
-
62
-
63
-
64
-
65
-
66
-
67
-
68
-
69
-
70
-
71
-
72
-
73
-
74
-
75
-
76
-
77
-
 78
78 -
 79
79 -
 80
80 -
 81
81 -
 82
82 -
 83
83 -
 84
84 -
 85
85 -
 86
86 -
 87
87 -
 88
88 -
 89
89 -
 90
90 -
 91
91 -
 92
92 -
 93
93 -
 94
94 -
 95
95 -
 96
96 -
 97
97 -
 98
98 -
99
-
100
-
101
-
102
-
103
-
104
-
105
-
106
-
107
-
108
-
109
-
110
-
111
-
112
-
113
-
114
-
115
-
116
-
117
-
118
-
119
-
120
-
121
-
122
-
123
-
124
-
125
-
126
-
127
-
128
-
129
-
130
 |
 |

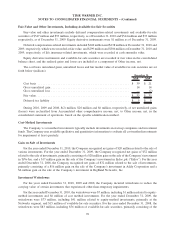
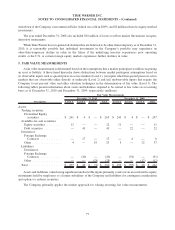
Fair-Value and Other Investments, Including Available-for-Sale Securities
Fair-value and other investments include deferred compensation-related investments and available-for-sale
securities of $547 million and $53 million, respectively, as of December 31, 2010 and $544 million and $33 million
respectively, as of December 31, 2009. Equity derivative instruments were $1 million as of December 31, 2009.
Deferred compensation-related investments included $248 million and $238 million at December 31, 2010 and
2009, respectively, which were recorded at fair value, and $299 million and $306 million at December 31, 2010 and
2009, respectively, of life insurance-related investments, which were recorded at cash surrender value.
Equity derivative instruments and available-for-sale securities are recorded at fair value in the consolidated
balance sheet, and the realized gains and losses are included as a component of Other income, net.
The cost basis, unrealized gains, unrealized losses and fair market value of available-for-sale securities are set
forth below (millions):
2010 2009
December 31,
Cost basis ....................................................... $ 39 $ 21
Gross unrealized gain ............................................... 14 14
Gross unrealized loss ............................................... — (2)
Fair value ........................................................ $ 53 $ 33
Deferred tax liability ............................................... $5$5
During 2010, 2009 and 2008, $(2) million, $20 million and $6 million, respectively, of net unrealized gains
(losses) were reclassified from Accumulated other comprehensive income, net, to Other income, net, in the
consolidated statement of operations, based on the specific identification method.
Cost-Method Investments
The Company’s cost-method investments typically include investments in start-up companies and investment
funds. The Company uses available qualitative and quantitative information to evaluate all cost-method investments
for impairment at least quarterly.
Gain on Sale of Investments
For the year ended December 31, 2010, the Company recognized net gains of $20 million related to the sale of
various investments. For the year ended December 31, 2009, the Company recognized net gains of $52 million
related to the sale of investments, primarily consisting of a $28 million gain on the sale of the Company’s investment
in TiVo Inc. and a $17 million gain on the sale of the Company’s investment in Eidos, plc (“Eidos”). For the year
ended December 31, 2008, the Company recognized net gains of $32 million related to the sale of investments,
primarily consisting of a $16 million gain on the sale of the Company’s investment in Adify Corporation and a
$6 million gain on the sale of the Company’s investment in BigBand Networks, Inc.
Investment Writedowns
For the years ended December 31, 2010, 2009 and 2008, the Company incurred writedowns to reduce the
carrying value of certain investments that experienced other-than-temporary impairments.
For the year ended December 31, 2010, the writedowns were $7 million, including $1 million related to equity-
method investments and $6 million of cost method investments. For the year ended December 31, 2009, the
writedowns were $73 million, including $41 million related to equity-method investments, primarily at the
Networks segment, and $15 million of available-for-sale securities. For the year ended December 31, 2008, the
writedowns were $83 million, including $56 million of available-for-sale securities, primarily consisting of the
76
TIME WARNER INC.
NOTES TO CONSOLIDATED FINANCIAL STATEMENTS – (Continued)