Time Magazine 2010 Annual Report Download - page 87
Download and view the complete annual report
Please find page 87 of the 2010 Time Magazine annual report below. You can navigate through the pages in the report by either clicking on the pages listed below, or by using the keyword search tool below to find specific information within the annual report.-
 1
1 -
2
-
3
-
4
-
5
-
6
-
7
-
8
-
9
-
10
-
11
-
12
-
13
-
14
-
15
-
16
-
17
-
18
-
19
-
20
-
21
-
22
-
23
-
24
-
25
-
26
-
27
-
28
-
29
-
30
-
31
-
32
-
33
-
34
-
35
-
36
-
37
-
38
-
39
-
40
-
41
-
42
-
43
-
44
-
45
-
46
-
47
-
48
-
49
-
50
-
51
-
52
-
53
-
54
-
55
-
56
-
57
-
58
-
59
-
60
-
61
-
62
-
63
-
64
-
65
-
66
-
67
-
68
-
69
-
70
-
71
-
72
-
73
-
74
-
75
-
76
-
 77
77 -
 78
78 -
 79
79 -
 80
80 -
 81
81 -
 82
82 -
 83
83 -
 84
84 -
 85
85 -
 86
86 -
 87
87 -
 88
88 -
 89
89 -
 90
90 -
 91
91 -
 92
92 -
 93
93 -
 94
94 -
 95
95 -
 96
96 -
 97
97 -
98
-
99
-
100
-
101
-
102
-
103
-
104
-
105
-
106
-
107
-
108
-
109
-
110
-
111
-
112
-
113
-
114
-
115
-
116
-
117
-
118
-
119
-
120
-
121
-
122
-
123
-
124
-
125
-
126
-
127
-
128
-
129
-
130
 |
 |

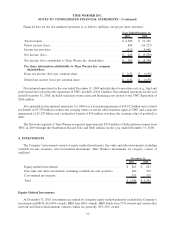
Financial data for the discontinued operations is as follows (millions, except per share amounts):
2009 2008
Years Ended December 31,
Total revenues .............................................. $ 6,500 $ 21,365
Pretax income (loss).......................................... 849 (14,227)
Income tax provision ......................................... (421) 4,668
Net income (loss)............................................ $ 428 $ (9,559)
Net income (loss) attributable to Time Warner Inc. shareholders ......... $ 389 $ (8,308)
Per share information attributable to Time Warner Inc. common
shareholders:
Basic net income (loss) per common share ......................... $ 0.32 $ (6.95)
Diluted net income (loss) per common share ........................ $ 0.32 $ (6.95)
Discontinued operations for the year ended December 31, 2009 included direct transaction costs (e.g., legal and
professional fees) related to the separations of TWC and AOL of $112 million. Discontinued operations for the year
ended December 31, 2008, included such direct transaction and financing costs related to the TWC Separation of
$206 million.
Also included in discontinued operations for 2008 was a noncash impairment of $14.822 billion and a related
tax benefit of $5.729 billion to reduce the carrying values of certain cable franchise rights at TWC and a noncash
impairment of $2.207 billion and a related tax benefit of $90 million to reduce the carrying value of goodwill at
AOL.
The Networks segment of Time Warner recognized approximately $170 million of Subscription revenues from
TWC in 2009 through the Distribution Record Date and $840 million for the year ended December 31, 2008.
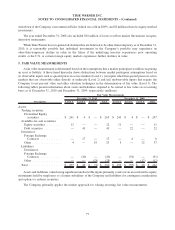
4. INVESTMENTS
The Company’s investments consist of equity-method investments, fair-value and other investments, including
available-for-sale securities, and cost-method investments. Time Warner’s investments, by category, consist of
(millions):
2010 2009
December 31,
Equity-method investments ....................................... $ 883 $ 641
Fair-value and other investments, including available-for-sale securities ...... 600 578
Cost-method investments......................................... 313 323
Total ....................................................... $ 1,796 $ 1,542
Equity-Method Investments
At December 31, 2010, investments accounted for using the equity method primarily included the Company’s
investments in HBO LAG (80% owned), HBO Asia (80% owned), HBO South Asia (75% owned) and certain other
network and filmed entertainment ventures which are generally 20%-50% owned.
75
TIME WARNER INC.
NOTES TO CONSOLIDATED FINANCIAL STATEMENTS – (Continued)