Time Magazine 2010 Annual Report Download - page 41
Download and view the complete annual report
Please find page 41 of the 2010 Time Magazine annual report below. You can navigate through the pages in the report by either clicking on the pages listed below, or by using the keyword search tool below to find specific information within the annual report.-
 1
1 -
2
-
3
-
4
-
5
-
6
-
7
-
8
-
9
-
10
-
11
-
12
-
13
-
14
-
15
-
16
-
17
-
18
-
19
-
20
-
21
-
22
-
23
-
24
-
25
-
26
-
27
-
28
-
29
-
30
-
 31
31 -
 32
32 -
 33
33 -
 34
34 -
 35
35 -
 36
36 -
 37
37 -
 38
38 -
 39
39 -
 40
40 -
 41
41 -
 42
42 -
 43
43 -
 44
44 -
 45
45 -
 46
46 -
 47
47 -
 48
48 -
 49
49 -
 50
50 -
 51
51 -
52
-
53
-
54
-
55
-
56
-
57
-
58
-
59
-
60
-
61
-
62
-
63
-
64
-
65
-
66
-
67
-
68
-
69
-
70
-
71
-
72
-
73
-
74
-
75
-
76
-
77
-
78
-
79
-
80
-
81
-
82
-
83
-
84
-
85
-
86
-
87
-
88
-
89
-
90
-
91
-
92
-
93
-
94
-
95
-
96
-
97
-
98
-
99
-
100
-
101
-
102
-
103
-
104
-
105
-
106
-
107
-
108
-
109
-
110
-
111
-
112
-
113
-
114
-
115
-
116
-
117
-
118
-
119
-
120
-
121
-
122
-
123
-
124
-
125
-
126
-
127
-
128
-
129
-
130
 |
 |

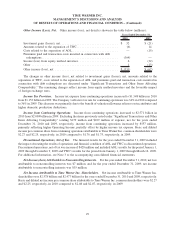
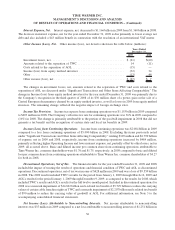
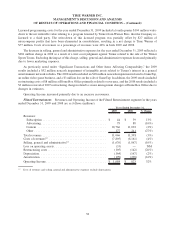
Other Income (Loss), Net. Other income (loss), net detail is shown in the table below (millions):
2010 2009
Years Ended December 31,
Investment gains (losses), net. . ................................. $ 32 $ (21)
Amounts related to the separation of TWC......................... (6) 14
Costs related to the separation of AOL............................ — (15)
Premiums paid and transaction costs incurred in connection with debt
redemptions.............................................. (364) —
Income (loss) from equity method investees ........................ 6 (32)
Other .................................................... 1 (13)
Other income (loss), net ...................................... $ (331) $ (67)
The changes in other income (loss), net related to investment gains (losses), net, amounts related to the
separation of TWC, costs related to the separation of AOL and premiums paid and transaction costs incurred in
connection with debt redemptions are discussed under “Significant Transactions and Other Items Affecting
Comparability.” The remaining changes reflect income from equity method investees and the favorable impact
of foreign exchange rates.
Income Tax Provision. Income tax expense from continuing operations increased to $1.348 billion in 2010
from $1.153 billion in 2009. The Company’s effective tax rate for continuing operations was 34% in 2010 compared
to 36% in 2009. This decrease was primarily due to the benefit of valuation allowance releases on tax attributes and
higher domestic production deductions.
Income from Continuing Operations. Income from continuing operations increased to $2.571 billion in
2010 from $2.084 billion in 2009. Excluding the items previously noted under “Significant Transactions and Other
Items Affecting Comparability” totaling $179 million and $109 million of expense, net for the years ended
December 31, 2010 and 2009, respectively, income from continuing operations increased by $557 million,
primarily reflecting higher Operating Income, partially offset by higher income tax expense. Basic and diluted
income per common share from continuing operations attributable to Time Warner Inc. common shareholders were
$2.27 and $2.25, respectively, in 2010 compared to $1.76 and $1.75, respectively, in 2009.
Discontinued Operations, Net of Tax. The financial results for the year ended December 31, 2009 included
the impact of treating the results of operations and financial condition of AOL and TWC as discontinued operations.
Discontinued operations, net of tax was income of $428 million and included AOL’s results for the period January 1,
2009 through December 9, 2009 and TWC’s results for the period from January 1, 2009 through March 12, 2009.
For additional information, see Note 3 to the accompanying consolidated financial statements.
Net Income (Loss) Attributable to Noncontrolling Interests. For the year ended December 31, 2010, net loss
attributable to noncontrolling interests was $7 million, and for the year ended December 31, 2009, net income
attributable to noncontrolling interests was $35 million.
Net Income Attributable to Time Warner Inc. Shareholders. Net income attributable to Time Warner Inc.
shareholders was $2.578 billion and $2.477 billion for the years ended December 31, 2010 and 2009, respectively.
Basic and diluted net income per common share attributable to Time Warner Inc. common shareholders were $2.27
and $2.25, respectively, in 2010 compared to $2.08 and $2.07, respectively, in 2009.
29
TIME WARNER INC.
MANAGEMENT’S DISCUSSION AND ANALYSIS
OF RESULTS OF OPERATIONS AND FINANCIAL CONDITION – (Continued)