Time Magazine 2010 Annual Report Download - page 51
Download and view the complete annual report
Please find page 51 of the 2010 Time Magazine annual report below. You can navigate through the pages in the report by either clicking on the pages listed below, or by using the keyword search tool below to find specific information within the annual report.-
 1
1 -
2
-
3
-
4
-
5
-
6
-
7
-
8
-
9
-
10
-
11
-
12
-
13
-
14
-
15
-
16
-
17
-
18
-
19
-
20
-
21
-
22
-
23
-
24
-
25
-
26
-
27
-
28
-
29
-
30
-
31
-
32
-
33
-
34
-
35
-
36
-
37
-
38
-
39
-
40
-
 41
41 -
 42
42 -
 43
43 -
 44
44 -
 45
45 -
 46
46 -
 47
47 -
 48
48 -
 49
49 -
 50
50 -
 51
51 -
 52
52 -
 53
53 -
 54
54 -
 55
55 -
 56
56 -
 57
57 -
 58
58 -
 59
59 -
 60
60 -
 61
61 -
62
-
63
-
64
-
65
-
66
-
67
-
68
-
69
-
70
-
71
-
72
-
73
-
74
-
75
-
76
-
77
-
78
-
79
-
80
-
81
-
82
-
83
-
84
-
85
-
86
-
87
-
88
-
89
-
90
-
91
-
92
-
93
-
94
-
95
-
96
-
97
-
98
-
99
-
100
-
101
-
102
-
103
-
104
-
105
-
106
-
107
-
108
-
109
-
110
-
111
-
112
-
113
-
114
-
115
-
116
-
117
-
118
-
119
-
120
-
121
-
122
-
123
-
124
-
125
-
126
-
127
-
128
-
129
-
130
 |
 |

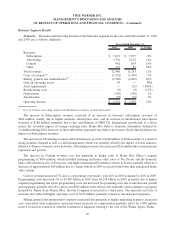
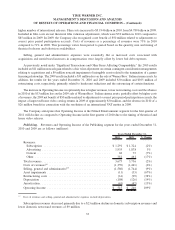
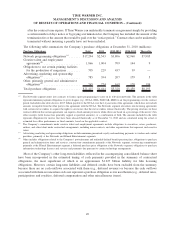
Content revenues primarily include theatrical product (which is content made available for initial exhibition in
theaters) and television product (which is content made available for initial airing on television). The components of
Content revenues for the years ended December 31, 2009 and 2008 are as follows (millions):
2009 2008 % Change
Years Ended December 31,
Theatrical product:
Theatrical film .................................... $ 2,085 $ 1,861 12%
Home video and electronic delivery ..................... 2,820 3,320 (15%)
Television licensing................................. 1,459 1,574 (7%)
Consumer products and other ......................... 129 191 (32%)
Total theatrical product ................................ 6,493 6,946 (7%)
Television product:
Television licensing................................. 2,506 2,274 10%
Home video and electronic delivery ..................... 777 814 (5%)
Consumer products and other ......................... 214 224 (4%)
Total television product................................ 3,497 3,312 6%
Other ............................................. 776 772 1%
Total Content revenues ................................ $ 10,766 $ 11,030 (2%)
The decline in Content revenues included the negative impact of foreign exchange rates on many of the
segment’s international operations.
The increase in theatrical film revenues was due primarily to the success of certain key releases in 2009, which
compared favorably to 2008. Revenues in 2009 included the releases of Harry Potter and the Half-Blood Prince, The
Hangover, The Blind Side, Sherlock Holmes and Terminator Salvation compared to revenues in 2008, which included
the releases of The Dark Knight,10,000 B.C.,Sex and the City,Get Smart and Journey to the Center of the Earth.
Theatrical product revenues from home video and electronic delivery decreased primarily due to the reduced quantity
and performance of new releases and lower catalog sales, driven in part by the negative impact of the current economic
environment and secular trends, partially offset by the effect of lower than anticipated catalog returns. Significant titles
in 2009 included Harry Potter and the Half-Blood Prince,The Hangover,Gran Torino and Terminator Salvation,
while significant titles in 2008 included The Dark Knight,IAmLegend,10,000 B.C.,The Bucket List and Sex and the
City. Theatrical product revenues from television licensing decreased due primarily to the timing and number of
availabilities. Theatrical product revenues from consumer products and other decreased due to difficult comparisons to
consumer product revenues in 2008, which included revenues from arrangements related to the release of The Dark
Knight in the third quarter of 2008 and the release of Speed Racer in the second quarter of 2008.
The increase in television product licensing fees was primarily due to the effect of fewer network deliveries in
2008 as a result of the Writers Guild of America (East and West) strike, which was settled in February 2008. The
decrease in television product revenues from Home video and electronic delivery primarily resulted from the
reduced quantity and performance of new releases and lower catalog sales, driven in part by the negative impact of
the current economic environment.
Other content revenues in 2009, which included the interactive videogame releases of LEGO Indiana Jones 2:
The Adventure Continues,F.E.A.R. 2: Project Origin and LEGO Rock Band as well as the expansion of the
distribution of third party interactive videogames, increased slightly compared to Other content revenues in 2008,
which included revenues from the interactive videogame releases of LEGO Indiana Jones and LEGO Batman.
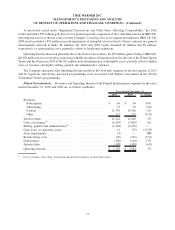
The decrease in costs of revenues resulted primarily from a $259 million decrease in theatrical advertising and
print costs due primarily to the timing, quantity and mix of films released and a $163 million decline in
manufacturing and related costs primarily associated with a decline in home video revenues. Film costs
39
TIME WARNER INC.
MANAGEMENT’S DISCUSSION AND ANALYSIS
OF RESULTS OF OPERATIONS AND FINANCIAL CONDITION – (Continued)