Time Magazine 2010 Annual Report Download - page 47
Download and view the complete annual report
Please find page 47 of the 2010 Time Magazine annual report below. You can navigate through the pages in the report by either clicking on the pages listed below, or by using the keyword search tool below to find specific information within the annual report.-
 1
1 -
2
-
3
-
4
-
5
-
6
-
7
-
8
-
9
-
10
-
11
-
12
-
13
-
14
-
15
-
16
-
17
-
18
-
19
-
20
-
21
-
22
-
23
-
24
-
25
-
26
-
27
-
28
-
29
-
30
-
31
-
32
-
33
-
34
-
35
-
36
-
 37
37 -
 38
38 -
 39
39 -
 40
40 -
 41
41 -
 42
42 -
 43
43 -
 44
44 -
 45
45 -
 46
46 -
 47
47 -
 48
48 -
 49
49 -
 50
50 -
 51
51 -
 52
52 -
 53
53 -
 54
54 -
 55
55 -
 56
56 -
 57
57 -
58
-
59
-
60
-
61
-
62
-
63
-
64
-
65
-
66
-
67
-
68
-
69
-
70
-
71
-
72
-
73
-
74
-
75
-
76
-
77
-
78
-
79
-
80
-
81
-
82
-
83
-
84
-
85
-
86
-
87
-
88
-
89
-
90
-
91
-
92
-
93
-
94
-
95
-
96
-
97
-
98
-
99
-
100
-
101
-
102
-
103
-
104
-
105
-
106
-
107
-
108
-
109
-
110
-
111
-
112
-
113
-
114
-
115
-
116
-
117
-
118
-
119
-
120
-
121
-
122
-
123
-
124
-
125
-
126
-
127
-
128
-
129
-
130
 |
 |

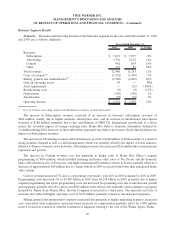
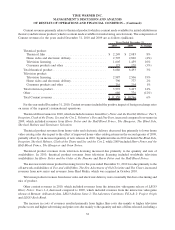
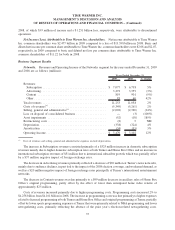
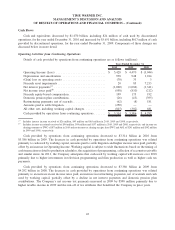
Revenues. The components of revenues are as follows (millions):
2009 2008 % Change
Years Ended December 31,
Subscription ........................................ $ 8,445 $ 8,300 2%
Advertising......................................... 5,161 5,798 (11%)
Content ........................................... 11,074 11,450 (3%)
Other ............................................. 708 886 (20%)
Total revenues ...................................... $ 25,388 $ 26,434 (4%)
The increase in Subscription revenues for the year ended December 31, 2009 was primarily related to an
increase at the Networks segment, offset partially by a decline at the Publishing segment. The decrease in
Advertising revenues for the year ended December 31, 2009 was primarily due to declines at the Publishing segment
and, to a lesser extent, a decline at the Networks segment. The decrease in Content revenues for the year ended
December 31, 2009 was due primarily to declines at the Filmed Entertainment and Networks segments. Each of the
revenue categories is discussed in greater detail by segment in “Business Segment Results.”
Costs of Revenues. For the years ended December 31, 2009 and 2008, costs of revenues totaled
$14.235 billion and $14.911 billion, respectively, and, as a percentage of revenues, were both 56%. The
segment variations are discussed in detail in “Business Segment Results.”
Selling, General and Administrative Expenses. For the years ended December 31, 2009 and 2008, selling,
general and administrative expenses decreased 9% to $6.073 billion in 2009 from $6.678 billion in 2008, due to
decreases across each of the segments. The segment variations are discussed in detail in “Business Segment
Results.”
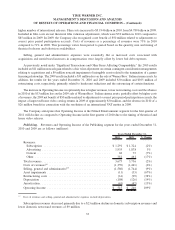
Included in costs of revenues and selling, general and administrative expenses is depreciation expense, which
was $668 million in both 2009 and 2008.
Amortization Expense. Amortization expense decreased to $280 million in 2009 from $346 million in 2008.
The decrease in amortization expense primarily related to declines at the Filmed Entertainment and Publishing
segments. The segment variations are discussed in detail in “Business Segment Results.”
Restructuring Costs. During the year ended December 31, 2009, the Company incurred restructuring costs of
$212 million primarily related to various employee terminations and other exit activities, including $8 million at the
Networks segment, $105 million at the Filmed Entertainment segment and $99 million at the Publishing segment.
The total number of employees terminated across the segments in 2009 was approximately 1,500.
During the year ended December 31, 2008, the Company incurred restructuring costs of $327 million, primarily
related to various employee terminations and other exit activities, including $142 million at the Filmed
Entertainment segment, $176 million at the Publishing segment and $12 million at the Corporate segment,
partially offset by a reversal of $3 million at the Networks segment. The total number of employees terminated
across the segments in 2008 was approximately 1,700.
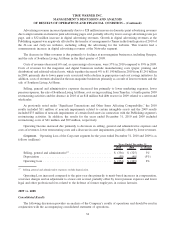
Operating Income (Loss). Operating Income was $4.470 billion in 2009 compared to Operating Loss of
$3.044 billion in 2008. Excluding the items previously noted under “Significant Transactions and Other
Items Affecting Comparability” totaling $148 million and $7.237 billion of expense for the years ended
December 31, 2009 and 2008, respectively, Operating Income increased $425 million, primarily reflecting
increases at the Networks and Filmed Entertainment segments, partially offset by a decline at the Publishing
segment. The segment variations are discussed under “Business Segment Results.”
35
TIME WARNER INC.
MANAGEMENT’S DISCUSSION AND ANALYSIS
OF RESULTS OF OPERATIONS AND FINANCIAL CONDITION – (Continued)