Time Magazine 2010 Annual Report Download - page 104
Download and view the complete annual report
Please find page 104 of the 2010 Time Magazine annual report below. You can navigate through the pages in the report by either clicking on the pages listed below, or by using the keyword search tool below to find specific information within the annual report.-
 1
1 -
2
-
3
-
4
-
5
-
6
-
7
-
8
-
9
-
10
-
11
-
12
-
13
-
14
-
15
-
16
-
17
-
18
-
19
-
20
-
21
-
22
-
23
-
24
-
25
-
26
-
27
-
28
-
29
-
30
-
31
-
32
-
33
-
34
-
35
-
36
-
37
-
38
-
39
-
40
-
41
-
42
-
43
-
44
-
45
-
46
-
47
-
48
-
49
-
50
-
51
-
52
-
53
-
54
-
55
-
56
-
57
-
58
-
59
-
60
-
61
-
62
-
63
-
64
-
65
-
66
-
67
-
68
-
69
-
70
-
71
-
72
-
73
-
74
-
75
-
76
-
77
-
78
-
79
-
80
-
81
-
82
-
83
-
84
-
85
-
86
-
87
-
88
-
89
-
90
-
91
-
92
-
93
-
 94
94 -
 95
95 -
 96
96 -
 97
97 -
 98
98 -
 99
99 -
 100
100 -
 101
101 -
 102
102 -
 103
103 -
 104
104 -
 105
105 -
 106
106 -
 107
107 -
 108
108 -
 109
109 -
 110
110 -
 111
111 -
 112
112 -
 113
113 -
 114
114 -
115
-
116
-
117
-
118
-
119
-
120
-
121
-
122
-
123
-
124
-
125
-
126
-
127
-
128
-
129
-
130
 |
 |

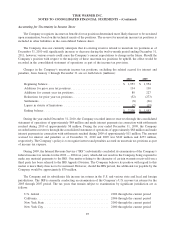
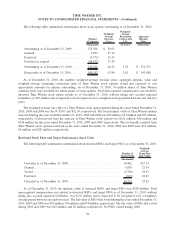
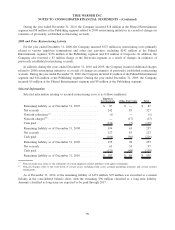
The following table summarizes information about stock options outstanding as of December 31, 2010:
Number
of Options
Weighted-
Average
Exercise
Price
Weighted-
Average
Remaining
Contractual
Life
Aggregate
Intrinsic
Value
(thousands) (in years) (thousands)
Outstanding as of December 31, 2009 ....... 174,396 $ 56.03
Granted.............................. 9,859 27.19
Exercised ............................ (5,572) 21.55
Forfeited or expired..................... (44,472) 77.50
Outstanding as of December 31, 2010 ....... 134,211 48.23 3.70 $ 351,571
Exercisable as of December 31, 2010. ....... 108,242 53.84 2.62 $ 143,888
As of December 31, 2010, the number, weighted-average exercise price, aggregate intrinsic value and
weighted-average remaining contractual term of Time Warner stock options vested and expected to vest
approximate amounts for options outstanding. As of December 31, 2010, 70 million shares of Time Warner
common stock were available for future grants of stock options. Total unrecognized compensation cost related to
unvested Time Warner stock option awards as of December 31, 2010, without taking into account expected
forfeitures, is $67 million and is expected to be recognized over a weighted-average period between one and two
years.
The weighted-average fair value of a Time Warner stock option granted during the years ended December 31,
2010, 2009 and 2008 was $6.39, $5.07 and $12.30, respectively. The total intrinsic value of Time Warner options
exercised during the years ended December 31, 2010, 2009 and 2008 was $45 million, $13 million and $53 million,
respectively. Cash received from the exercise of Time Warner stock options was $121 million, $56 million and
$134 million for the years ended December 31, 2010, 2009 and 2008, respectively. The tax benefits realized from
Time Warner stock options exercised in the years ended December 31, 2010, 2009 and 2008 were $17 million,
$5 million and $20 million, respectively.
Restricted Stock Units and Target Performance Stock Units
The following table summarizes information about unvested RSUs and target PSUs as of December 31, 2010:
Number of
Shares/Units
Weighted-
Average
Grant Date
Fair Value
(thousands)
Unvested as of December 31, 2009 .............................. 14,462 $27.15
Granted .................................................. 5,870 27.34
Vested ................................................... (2,796) 38.35
Forfeited ................................................. (813) 28.87
Unvested as of December 31, 2010 .............................. 16,723 25.25
As of December 31, 2010, the intrinsic value of unvested RSUs and target PSUs was $538 million. Total
unrecognized compensation cost related to unvested RSUs and target PSUs as of December 31, 2010, without
taking into account expected forfeitures, was $156 million and is expected to be recognized over a weighted-
average period between one and two years. The fair value of RSUs that vested during the years ended December 31,
2010, 2009 and 2008 was $95 million, $76 million and $59 million, respectively. The fair value of PSUs that vested
during 2010 and 2009 was $12 million and $2 million, respectively. No PSUs vested during 2008.
92
TIME WARNER INC.
NOTES TO CONSOLIDATED FINANCIAL STATEMENTS – (Continued)