Time Magazine 2010 Annual Report Download - page 42
Download and view the complete annual report
Please find page 42 of the 2010 Time Magazine annual report below. You can navigate through the pages in the report by either clicking on the pages listed below, or by using the keyword search tool below to find specific information within the annual report.-
 1
1 -
2
-
3
-
4
-
5
-
6
-
7
-
8
-
9
-
10
-
11
-
12
-
13
-
14
-
15
-
16
-
17
-
18
-
19
-
20
-
21
-
22
-
23
-
24
-
25
-
26
-
27
-
28
-
29
-
30
-
31
-
 32
32 -
 33
33 -
 34
34 -
 35
35 -
 36
36 -
 37
37 -
 38
38 -
 39
39 -
 40
40 -
 41
41 -
 42
42 -
 43
43 -
 44
44 -
 45
45 -
 46
46 -
 47
47 -
 48
48 -
 49
49 -
 50
50 -
 51
51 -
 52
52 -
53
-
54
-
55
-
56
-
57
-
58
-
59
-
60
-
61
-
62
-
63
-
64
-
65
-
66
-
67
-
68
-
69
-
70
-
71
-
72
-
73
-
74
-
75
-
76
-
77
-
78
-
79
-
80
-
81
-
82
-
83
-
84
-
85
-
86
-
87
-
88
-
89
-
90
-
91
-
92
-
93
-
94
-
95
-
96
-
97
-
98
-
99
-
100
-
101
-
102
-
103
-
104
-
105
-
106
-
107
-
108
-
109
-
110
-
111
-
112
-
113
-
114
-
115
-
116
-
117
-
118
-
119
-
120
-
121
-
122
-
123
-
124
-
125
-
126
-
127
-
128
-
129
-
130
 |
 |

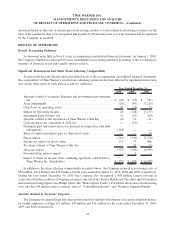
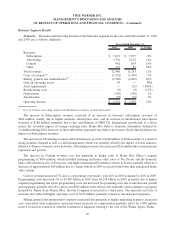
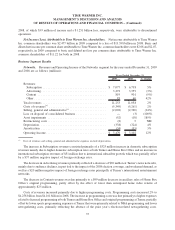
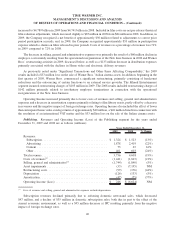
Business Segment Results
Networks. Revenues and Operating Income of the Networks segment for the years ended December 31, 2010
and 2009 are as follows (millions):
2010 2009 % Change
Years Ended December 31,
Revenues:
Subscription ...................................... $ 7,671 $ 7,077 8%
Advertising ....................................... 3,736 3,272 14%
Content ......................................... 942 819 15%
Other ........................................... 131 85 54%
Total revenues ...................................... 12,480 11,253 11%
Costs of revenues
(a)
.................................. (5,732) (5,349) 7%
Selling, general and administrative
(a)
...................... (2,200) (2,002) 10%
Gain on operating assets ............................... 59 — NM
Asset impairments ................................... — (52) (100%)
Restructuring costs ................................... (6) (8) (25%)
Depreciation ........................................ (342) (338) 1%
Amortization ....................................... (35) (34) 3%
Operating Income .................................... $ 4,224 $ 3,470 22%
(a)
Costs of revenues and selling, general and administrative expenses exclude depreciation.
The increase in Subscription revenues consisted of an increase in domestic subscription revenues of
$406 million, mainly due to higher domestic subscription rates, and an increase in international subscription
revenues of $188 million, primarily due to the consolidation of HBO CE, international growth and, to a lesser
extent, the favorable impact of foreign exchange rates. Home Box Office’s domestic subscribers declined by
1.6 million during 2010; however, as these subscribers generated very little or no revenue, the decline had almost no
impact on Subscription revenues.
The increase in Advertising revenues reflected domestic growth of $248 million at Turner mainly as a result of
strong domestic demand as well as yield management, which was partially offset by the impact of lower audience
delivery at Turner’s domestic news networks. Advertising revenues also increased $216 million due to international
expansion and growth.
The increase in Content revenues was due primarily to higher sales of Home Box Office’s original
programming of $104 million, which included licensing and home video sales of The Pacific and the domestic
basic cable television sale of Entourage, and higher international licensing revenues at Turner, partially offset by a
decrease of approximately $20 million due to a larger benefit in 2009 associated with lower than anticipated home
video returns.
Costs of revenues increased 7% and, as a percentage of revenues, were 46% in 2010 compared to 48% in 2009.
Programming costs increased 5% to $4.485 billion in 2010 from $4.258 billion in 2009, primarily due to higher
original programming and sports programming costs and increased programming costs due to international growth
and expansion, partially offset by a prior year $104 million write-down to net realizable value relating to a program
licensed by Turner from Warner Bros. that the Company re-licensed to a third party. The increases in Costs of
revenues also reflected higher operating costs of $156 million primarily related to international expansion.
Selling, general and administrative expenses increased due primarily to higher marketing expenses, increased
costs associated with acquisitions and merit-based increases in compensation, partially offset by a $58 million
reserve reversal in connection with the resolution of litigation relating to the sale of the Winter Sports Teams.
30
TIME WARNER INC.
MANAGEMENT’S DISCUSSION AND ANALYSIS
OF RESULTS OF OPERATIONS AND FINANCIAL CONDITION – (Continued)