Time Magazine 2010 Annual Report Download - page 57
Download and view the complete annual report
Please find page 57 of the 2010 Time Magazine annual report below. You can navigate through the pages in the report by either clicking on the pages listed below, or by using the keyword search tool below to find specific information within the annual report.-
 1
1 -
2
-
3
-
4
-
5
-
6
-
7
-
8
-
9
-
10
-
11
-
12
-
13
-
14
-
15
-
16
-
17
-
18
-
19
-
20
-
21
-
22
-
23
-
24
-
25
-
26
-
27
-
28
-
29
-
30
-
31
-
32
-
33
-
34
-
35
-
36
-
37
-
38
-
39
-
40
-
41
-
42
-
43
-
44
-
45
-
46
-
 47
47 -
 48
48 -
 49
49 -
 50
50 -
 51
51 -
 52
52 -
 53
53 -
 54
54 -
 55
55 -
 56
56 -
 57
57 -
 58
58 -
 59
59 -
 60
60 -
 61
61 -
 62
62 -
 63
63 -
 64
64 -
 65
65 -
 66
66 -
 67
67 -
68
-
69
-
70
-
71
-
72
-
73
-
74
-
75
-
76
-
77
-
78
-
79
-
80
-
81
-
82
-
83
-
84
-
85
-
86
-
87
-
88
-
89
-
90
-
91
-
92
-
93
-
94
-
95
-
96
-
97
-
98
-
99
-
100
-
101
-
102
-
103
-
104
-
105
-
106
-
107
-
108
-
109
-
110
-
111
-
112
-
113
-
114
-
115
-
116
-
117
-
118
-
119
-
120
-
121
-
122
-
123
-
124
-
125
-
126
-
127
-
128
-
129
-
130
 |
 |

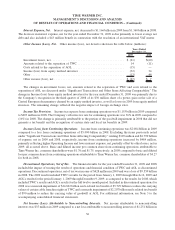
Cash used by financing activities from continuing operations decreased to $2.924 billion in 2010 from
$8.540 billion in 2009. The decrease in cash used by financing activities from continuing operations was primarily
due to a decrease in debt repayments and an increase in borrowings, partially offset by an increase in repurchases of
common stock made in connection with the Company’s common stock repurchase program. Other financing
activities include the premiums and transaction costs paid in connection with the 2010 Debt Redemptions. As
discussed under “Recent Developments,” the borrowings and debt repayments in 2010 primarily reflect a series of
transactions that capitalized on the historically low interest rate environment and extended the average maturity of
the Company’s debt. In 2009, the Company used a portion of the $9.253 billion it received from the payment of the
Special Dividend to repay in full its $2.000 billion three-year unsecured term loan facility (plus accrued interest)
and repay all amounts outstanding under the Prior Credit Agreement (defined below). In addition, the Company
paid $2.000 billion (plus accrued interest) for floating rate public debt that matured on November 13, 2009.
Cash used by financing activities from continuing operations increased to $8.540 billion in 2009 from
$2.895 billion in 2008. The change in cash used by financing activities from continuing operations was primarily
due to an increase in net debt repayments and an increase in repurchases of common stock made in connection with
the Company’s common stock repurchase program.
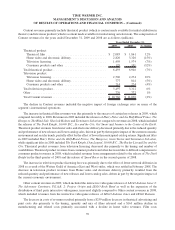
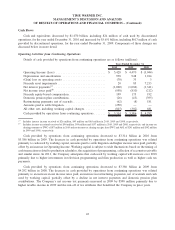
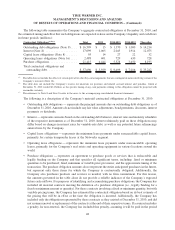
Cash Flows from Discontinued Operations
Details of cash provided (used) by discontinued operations are as follows (millions):
2010 2009 2008
Years Ended December 31,
Cash provided (used) by operations from discontinued operations ..... $ (24) $ 1,324 $ 6,268
Cash used by investing activities from discontinued operations ....... — (763) (5,213)
Cash provided (used) by financing activities from discontinued
operations............................................. — (5,255) 3,983
Effect of change in cash and equivalents of discontinued operations .... — 5,311 (5,200)
Cash provided (used) by discontinued operations .................. $ (24) $ 617 $ (162)
Cash used by discontinued operations was $24 million in 2010 as compared to cash provided by discontinued
operations of $617 million in 2009, which primarily reflected the cash activity associated with AOL.
For the year ended December 31, 2009, cash provided (used) by discontinued operations primarily reflected
cash activity of TWC and AOL through their separations from the Company on March 12, 2009 and December 9,
2009, respectively, and, for the year ended December 31, 2008, it primarily reflected cash activity of TWC and AOL
for the entire twelve-month period. The cash used by financing activities from discontinued operations of
$5.255 billion for the year ended December 31, 2009 reflects TWC’s payment of the Special Dividend,
partially offset by an increase in borrowings. Cash provided by discontinued operations of $617 million in
2009 compared to cash used by discontinued operations of $162 million in 2008 primarily reflected a decline in net
investment and acquisition expenditures at AOL.
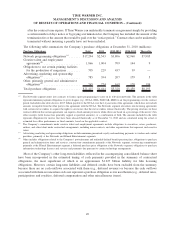
Outstanding Debt and Other Financing Arrangements
Outstanding Debt and Committed Financial Capacity
At December 31, 2010, Time Warner had total committed capacity, defined as maximum available borrowings
under various existing debt arrangements and cash and short-term investments, of $25.314 billion. Of this
committed capacity, $8.700 billion was unused and $16.549 billion was outstanding as debt. At December 31,
45
TIME WARNER INC.
MANAGEMENT’S DISCUSSION AND ANALYSIS
OF RESULTS OF OPERATIONS AND FINANCIAL CONDITION – (Continued)