Time Magazine 2010 Annual Report Download - page 45
Download and view the complete annual report
Please find page 45 of the 2010 Time Magazine annual report below. You can navigate through the pages in the report by either clicking on the pages listed below, or by using the keyword search tool below to find specific information within the annual report.-
 1
1 -
2
-
3
-
4
-
5
-
6
-
7
-
8
-
9
-
10
-
11
-
12
-
13
-
14
-
15
-
16
-
17
-
18
-
19
-
20
-
21
-
22
-
23
-
24
-
25
-
26
-
27
-
28
-
29
-
30
-
31
-
32
-
33
-
34
-
 35
35 -
 36
36 -
 37
37 -
 38
38 -
 39
39 -
 40
40 -
 41
41 -
 42
42 -
 43
43 -
 44
44 -
 45
45 -
 46
46 -
 47
47 -
 48
48 -
 49
49 -
 50
50 -
 51
51 -
 52
52 -
 53
53 -
 54
54 -
 55
55 -
56
-
57
-
58
-
59
-
60
-
61
-
62
-
63
-
64
-
65
-
66
-
67
-
68
-
69
-
70
-
71
-
72
-
73
-
74
-
75
-
76
-
77
-
78
-
79
-
80
-
81
-
82
-
83
-
84
-
85
-
86
-
87
-
88
-
89
-
90
-
91
-
92
-
93
-
94
-
95
-
96
-
97
-
98
-
99
-
100
-
101
-
102
-
103
-
104
-
105
-
106
-
107
-
108
-
109
-
110
-
111
-
112
-
113
-
114
-
115
-
116
-
117
-
118
-
119
-
120
-
121
-
122
-
123
-
124
-
125
-
126
-
127
-
128
-
129
-
130
 |
 |

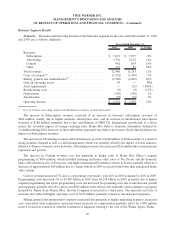
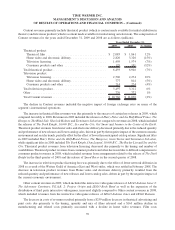
higher number of international releases. Film costs increased to $5.194 billion in 2010 from $4.789 billion in 2009.
Included in film costs are net theatrical film valuation adjustments, which were $78 million in 2010 compared to
$85 million in 2009. In 2009, the Company also recognized a net benefit of $50 million related to adjustments to
correct prior period participation accruals. Costs of revenues as a percentage of revenues were 73% in 2010
compared to 71% in 2009. This percentage varies from period to period based on the quantity, mix and timing of
theatrical releases and television availabilities.
Selling, general and administrative expenses were essentially flat as increased costs associated with
acquisitions and merit-based increases in compensation were largely offset by lower bad debt expenses.
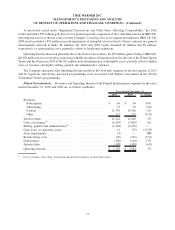
As previously noted under “Significant Transactions and Other Items Affecting Comparability,” the 2010 results
included an $11 million noncash gain related to a fair value adjustment on certain contingent consideration arrangements
relating to acquisitions and a $9 million noncash impairment of intangible assets related to the termination of a games
licensing relationship. The 2009 results included a $33 million loss on the sale of Warner Bros.’ Italian cinema assets. In
addition, the results for the years ended December 31, 2010 and 2009 included $30 million and $105 million of
restructuring costs, respectively, primarily related to headcount reductions and the outsourcing of certain functions.
The increase in Operating Income was primarily due to higher revenues, lower restructuring costs and the absence
in 2010 of the $33 million loss on the 2009 sale of Warner Bros.’ Italian cinema assets, partially offset by higher costs
of revenues, the 2009 net benefit of $50 million related to adjustments to correct prior period participation accruals, the
impact of improved home video catalog returns in 2009 of approximately $30 million, and the absence in 2010 of a
$26 million benefit in connection with the resolution of an international VAT matter in 2009.
The Company anticipates that Operating Income at the Filmed Entertainment segment for the first quarter of
2011 will decline as compared to Operating Income in the first quarter of 2010 due to the timing of theatrical and
home video releases.
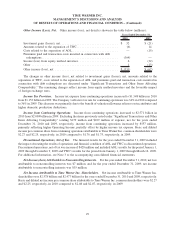
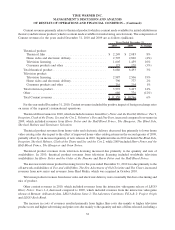
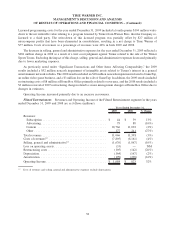
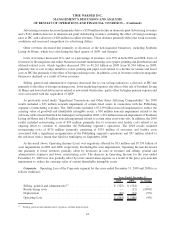
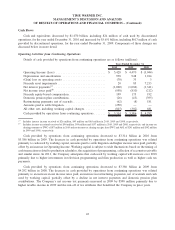
Publishing. Revenues and Operating Income of the Publishing segment for the years ended December 31,
2010 and 2009 are as follows (millions):
2010 2009 % Change
Years Ended December 31,
Revenues:
Subscription ........................................ $1,291 $ 1,324 (2%)
Advertising ......................................... 1,935 1,878 3%
Content ............................................ 68 73 (7%)
Other.............................................. 381 461 (17%)
Total revenues ......................................... 3,675 3,736 (2%)
Costs of revenues
(a)
..................................... (1,359) (1,441) (6%)
Selling, general and administrative
(a)
........................ (1,580) (1,744) (9%)
Asset impairments ...................................... (11) (33) (67%)
Restructuring costs ..................................... (61) (99) (38%)
Depreciation .......................................... (108) (126) (14%)
Amortization .......................................... (41) (47) (13%)
Operating Income ...................................... $ 515 $ 246 109%
(a)
Costs of revenues and selling, general and administrative expenses exclude depreciation.
Subscription revenues decreased primarily due to a $23 million decline in domestic subscription revenues and
lower domestic newsstand revenues of $9 million.
33
TIME WARNER INC.
MANAGEMENT’S DISCUSSION AND ANALYSIS
OF RESULTS OF OPERATIONS AND FINANCIAL CONDITION – (Continued)