Time Magazine 2010 Annual Report Download - page 46
Download and view the complete annual report
Please find page 46 of the 2010 Time Magazine annual report below. You can navigate through the pages in the report by either clicking on the pages listed below, or by using the keyword search tool below to find specific information within the annual report.-
 1
1 -
2
-
3
-
4
-
5
-
6
-
7
-
8
-
9
-
10
-
11
-
12
-
13
-
14
-
15
-
16
-
17
-
18
-
19
-
20
-
21
-
22
-
23
-
24
-
25
-
26
-
27
-
28
-
29
-
30
-
31
-
32
-
33
-
34
-
35
-
 36
36 -
 37
37 -
 38
38 -
 39
39 -
 40
40 -
 41
41 -
 42
42 -
 43
43 -
 44
44 -
 45
45 -
 46
46 -
 47
47 -
 48
48 -
 49
49 -
 50
50 -
 51
51 -
 52
52 -
 53
53 -
 54
54 -
 55
55 -
 56
56 -
57
-
58
-
59
-
60
-
61
-
62
-
63
-
64
-
65
-
66
-
67
-
68
-
69
-
70
-
71
-
72
-
73
-
74
-
75
-
76
-
77
-
78
-
79
-
80
-
81
-
82
-
83
-
84
-
85
-
86
-
87
-
88
-
89
-
90
-
91
-
92
-
93
-
94
-
95
-
96
-
97
-
98
-
99
-
100
-
101
-
102
-
103
-
104
-
105
-
106
-
107
-
108
-
109
-
110
-
111
-
112
-
113
-
114
-
115
-
116
-
117
-
118
-
119
-
120
-
121
-
122
-
123
-
124
-
125
-
126
-
127
-
128
-
129
-
130
 |
 |

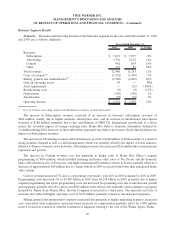
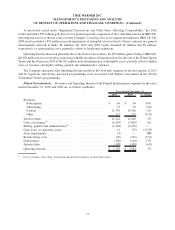
Advertising revenues increased primarily due to a $28 million increase in domestic print advertising revenues
due to improvements in domestic print advertising pages sold, partially offset by lower average advertising rates per
page, and a $32 million increase in digital advertising revenues. Growth in digital advertising revenues at the
Publishing segment was negatively affected by the transfer of management to Turner in the fourth quarter of 2010 of
the SI.com and Golf.com websites, including selling the advertising for the websites. This transfer had a
commensurate increase in digital advertising revenues at the Networks segment.
The decrease in Other revenues is due primarily to declines at non-magazine businesses, including Synapse,
and the sale of Southern Living At Home in the third quarter of 2009.
Costs of revenues decreased 6% and, as a percentage of revenues, were 37% in 2010 compared to 39% in 2009.
Costs of revenues for the magazine and digital businesses include manufacturing costs (paper, printing and
distribution) and editorial-related costs, which together decreased 4% to $1.190 billion in 2010 from $1.241 billion
in 2009, primarily due to lower paper costs associated with a decline in paper prices and cost savings initiatives. In
addition, costs of revenues declined at the non-magazine businesses primarily as a result of lower revenues and the
sale of Southern Living At Home.
Selling, general and administrative expenses decreased due primarily to lower marketing expenses, lower
pension expenses, the sale of Southern Living At Home, cost savings resulting from Time Inc.’s fourth quarter 2009
restructuring activities and the absence in 2010 of an $18 million bad debt reserve in 2009 related to a newsstand
wholesaler.
As previously noted under “Significant Transactions and Other Items Affecting Comparability,” the 2010
results included $11 million of noncash impairments related to certain intangible assets and the 2009 results
included $33 million of noncash impairments of certain fixed assets in connection with the Publishing segment’s
restructuring activities. In addition, the results for the years ended December 31, 2010 and 2009 included
restructuring costs of $61 million and $99 million, respectively.
Operating Income increased due primarily to decreases in selling, general and administrative expenses and
costs of revenues, lower restructuring costs and a decrease in asset impairments, partially offset by lower revenues.
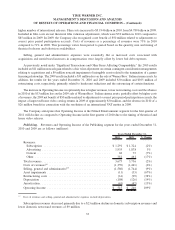
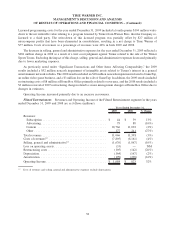
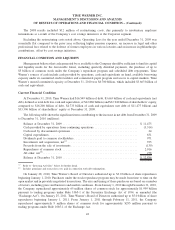
Corporate. Operating Loss of the Corporate segment for the years ended December 31, 2010 and 2009 is as
follows (millions):
2010 2009 % Change
Years Ended December 31,
Selling, general and administrative
(a)
......................... $ (336) $ (325) 3%
Depreciation ........................................... (38) (40) (5%)
Operating Loss ......................................... $ (374) $ (365) 2%
(a)
Selling, general and administrative expenses exclude depreciation.
Operating Loss increased compared to the prior year due primarily to merit-based increases in compensation,
severance charges and an adjustment to a lease exit accrual, partially offset by lower pension expenses and lower
legal and other professional fees related to the defense of former employees in various lawsuits.
2009 vs. 2008
Consolidated Results
The following discussion provides an analysis of the Company’s results of operations and should be read in
conjunction with the accompanying consolidated statement of operations.
34
TIME WARNER INC.
MANAGEMENT’S DISCUSSION AND ANALYSIS
OF RESULTS OF OPERATIONS AND FINANCIAL CONDITION – (Continued)