Time Magazine 2010 Annual Report Download - page 114
Download and view the complete annual report
Please find page 114 of the 2010 Time Magazine annual report below. You can navigate through the pages in the report by either clicking on the pages listed below, or by using the keyword search tool below to find specific information within the annual report.-
 1
1 -
2
-
3
-
4
-
5
-
6
-
7
-
8
-
9
-
10
-
11
-
12
-
13
-
14
-
15
-
16
-
17
-
18
-
19
-
20
-
21
-
22
-
23
-
24
-
25
-
26
-
27
-
28
-
29
-
30
-
31
-
32
-
33
-
34
-
35
-
36
-
37
-
38
-
39
-
40
-
41
-
42
-
43
-
44
-
45
-
46
-
47
-
48
-
49
-
50
-
51
-
52
-
53
-
54
-
55
-
56
-
57
-
58
-
59
-
60
-
61
-
62
-
63
-
64
-
65
-
66
-
67
-
68
-
69
-
70
-
71
-
72
-
73
-
74
-
75
-
76
-
77
-
78
-
79
-
80
-
81
-
82
-
83
-
84
-
85
-
86
-
87
-
88
-
89
-
90
-
91
-
92
-
93
-
94
-
95
-
96
-
97
-
98
-
99
-
100
-
101
-
102
-
103
-
 104
104 -
 105
105 -
 106
106 -
 107
107 -
 108
108 -
 109
109 -
 110
110 -
 111
111 -
 112
112 -
 113
113 -
 114
114 -
 115
115 -
 116
116 -
 117
117 -
 118
118 -
 119
119 -
 120
120 -
 121
121 -
 122
122 -
 123
123 -
 124
124 -
125
-
126
-
127
-
128
-
129
-
130
 |
 |

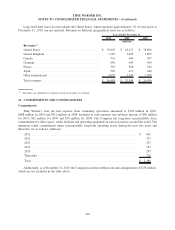
Long-lived hard assets located outside the United States, which represent approximately 1% of total assets at
December 31, 2010, are not material. Revenues in different geographical areas are as follows:
2010 2009 2008
Years Ended December 31,
(millions)
Revenues
(a)
United States ................................... $ 19,007 $ 18,113 $ 18,894
United Kingdom ................................. 1,387 1,495 1,809
Canada ........................................ 731 646 597
Germany . . . ................................... 656 643 564
France ........................................ 519 580 540
Japan ......................................... 509 471 440
Other international ............................... 4,079 3,440 3,590
Total revenues .................................. $ 26,888 $ 25,388 $ 26,434
(a)
Revenues are attributed to countries based on location of customer.
16. COMMITMENTS AND CONTINGENCIES
Commitments
Time Warner’s total net rent expense from continuing operations amounted to $398 million in 2010,
$408 million in 2009 and $412 million in 2008. Included in such amounts was sublease income of $46 million
for 2010, $52 million for 2009 and $59 million for 2008. The Company has long-term noncancelable lease
commitments for office space, studio facilities and operating equipment in various locations around the world. The
minimum rental commitments under noncancelable long-term operating leases during the next five years and
thereafter are as follows (millions):
2011 ............................................................... $ 401
2012 ............................................................... 372
2013 ............................................................... 357
2014 ............................................................... 333
2015 ............................................................... 297
Thereafter ........................................................... 728
Total ............................................................... $ 2,488
Additionally, as of December 31, 2010, the Company has future sublease income arrangements of $278 million,
which are not included in the table above.
102
TIME WARNER INC.
NOTES TO CONSOLIDATED FINANCIAL STATEMENTS – (Continued)