Time Magazine 2010 Annual Report Download - page 54
Download and view the complete annual report
Please find page 54 of the 2010 Time Magazine annual report below. You can navigate through the pages in the report by either clicking on the pages listed below, or by using the keyword search tool below to find specific information within the annual report.-
 1
1 -
2
-
3
-
4
-
5
-
6
-
7
-
8
-
9
-
10
-
11
-
12
-
13
-
14
-
15
-
16
-
17
-
18
-
19
-
20
-
21
-
22
-
23
-
24
-
25
-
26
-
27
-
28
-
29
-
30
-
31
-
32
-
33
-
34
-
35
-
36
-
37
-
38
-
39
-
40
-
41
-
42
-
43
-
 44
44 -
 45
45 -
 46
46 -
 47
47 -
 48
48 -
 49
49 -
 50
50 -
 51
51 -
 52
52 -
 53
53 -
 54
54 -
 55
55 -
 56
56 -
 57
57 -
 58
58 -
 59
59 -
 60
60 -
 61
61 -
 62
62 -
 63
63 -
 64
64 -
65
-
66
-
67
-
68
-
69
-
70
-
71
-
72
-
73
-
74
-
75
-
76
-
77
-
78
-
79
-
80
-
81
-
82
-
83
-
84
-
85
-
86
-
87
-
88
-
89
-
90
-
91
-
92
-
93
-
94
-
95
-
96
-
97
-
98
-
99
-
100
-
101
-
102
-
103
-
104
-
105
-
106
-
107
-
108
-
109
-
110
-
111
-
112
-
113
-
114
-
115
-
116
-
117
-
118
-
119
-
120
-
121
-
122
-
123
-
124
-
125
-
126
-
127
-
128
-
129
-
130
 |
 |

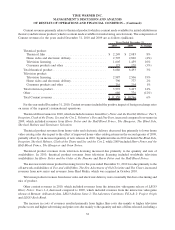
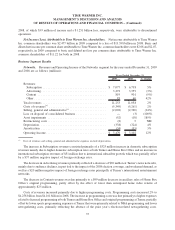
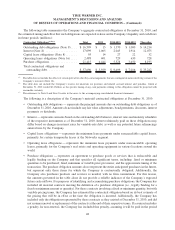
The 2008 results included $12 million of restructuring costs, due primarily to involuntary employee
terminations as a result of the Company’s cost savings initiatives at the Corporate segment.
Excluding the restructuring costs noted above, Operating Loss for the year ended December 31, 2009 was
essentially flat compared to the prior year, reflecting higher pension expenses, an increase in legal and other
professional fees related to the defense of former employees in various lawsuits and an increase in philanthropic
contributions, offset by cost savings initiatives.
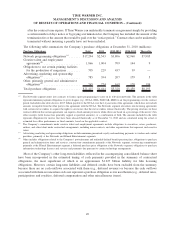
FINANCIAL CONDITION AND LIQUIDITY
Management believes that cash generated by or available to the Company should be sufficient to fund its capital
and liquidity needs for the foreseeable future, including quarterly dividend payments, the purchase of up to
$5 billion of common stock under the Company’s repurchase program and scheduled debt repayments. Time
Warner’s sources of cash include cash provided by operations, cash and equivalents on hand, available borrowing
capacity under its committed credit facilities and commercial paper program and access to capital markets. Time
Warner’s unused committed capacity at December 31, 2010 was $8.700 billion, which included $3.663 billion of
cash and equivalents.
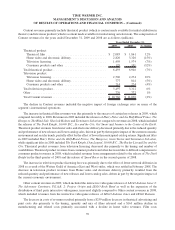
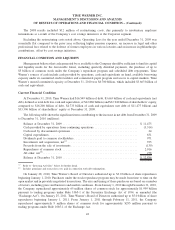
Current Financial Condition
At December 31, 2010, Time Warner had $16.549 billion of debt, $3.663 billion of cash and equivalents (net
debt, defined as total debt less cash and equivalents, of $12.886 billion) and $32.940 billion of shareholders’ equity,
compared to $16.208 billion of debt, $4.733 billion of cash and equivalents (net debt of $11.475 billion) and
$33.396 billion of shareholders’ equity at December 31, 2009.
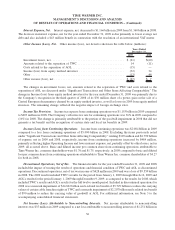
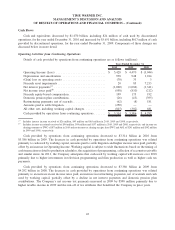
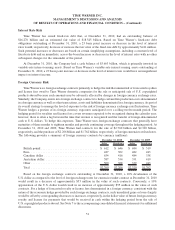
The following table shows the significant items contributing to the increase in net debt from December 31, 2009
to December 31, 2010 (millions):
Balance at December 31, 2009 ............................................. $ 11,475
Cash provided by operations from continuing operations .......................... (3,314)
Cash used by discontinued operations ........................................ 24
Capital expenditures ..................................................... 631
Dividends paid to common stockholders ...................................... 971
Investments and acquisitions, net
(a)
.......................................... 935
Proceeds from the sale of investments ........................................ (130)
Repurchases of common stock ............................................. 2,016
All other, net
(b)
......................................................... 278
Balance at December 31, 2010 ............................................. $ 12,886
(a)
Refer to “Investing Activities” below for further detail.
(b)
Includes premiums and transaction costs paid in connection with debt redemptions.
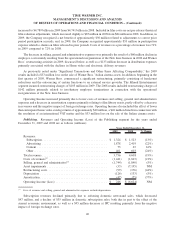
On January 28, 2010, Time Warner’s Board of Directors authorized up to $3.0 billion of share repurchases
beginning January 1, 2010. Purchases under the stock repurchase program may be made from time to time on the
open market and in privately negotiated transactions. The size and timing of these purchases are based on a number
of factors, including price and business and market conditions. From January 1, 2010 through December 31, 2010,
the Company repurchased approximately 65 million shares of common stock for approximately $1.999 billion
pursuant to trading programs under Rule 10b5-1 of the Securities Exchange Act of 1934, as amended (the
“Exchange Act”). On January 25, 2011, Time Warner’s Board of Directors authorized up to $5.0 billion of share
repurchases beginning January 1, 2011. From January 1, 2011 through February 11, 2011, the Company
repurchased approximately 9 million shares of common stock for approximately $295 million pursuant to
trading programs under Rule 10b5-1 of the Exchange Act.
42
TIME WARNER INC.
MANAGEMENT’S DISCUSSION AND ANALYSIS
OF RESULTS OF OPERATIONS AND FINANCIAL CONDITION – (Continued)