Time Magazine 2010 Annual Report Download - page 126
Download and view the complete annual report
Please find page 126 of the 2010 Time Magazine annual report below. You can navigate through the pages in the report by either clicking on the pages listed below, or by using the keyword search tool below to find specific information within the annual report.-
 1
1 -
2
-
3
-
4
-
5
-
6
-
7
-
8
-
9
-
10
-
11
-
12
-
13
-
14
-
15
-
16
-
17
-
18
-
19
-
20
-
21
-
22
-
23
-
24
-
25
-
26
-
27
-
28
-
29
-
30
-
31
-
32
-
33
-
34
-
35
-
36
-
37
-
38
-
39
-
40
-
41
-
42
-
43
-
44
-
45
-
46
-
47
-
48
-
49
-
50
-
51
-
52
-
53
-
54
-
55
-
56
-
57
-
58
-
59
-
60
-
61
-
62
-
63
-
64
-
65
-
66
-
67
-
68
-
69
-
70
-
71
-
72
-
73
-
74
-
75
-
76
-
77
-
78
-
79
-
80
-
81
-
82
-
83
-
84
-
85
-
86
-
87
-
88
-
89
-
90
-
91
-
92
-
93
-
94
-
95
-
96
-
97
-
98
-
99
-
100
-
101
-
102
-
103
-
104
-
105
-
106
-
107
-
108
-
109
-
110
-
111
-
112
-
113
-
114
-
115
-
 116
116 -
 117
117 -
 118
118 -
 119
119 -
 120
120 -
 121
121 -
 122
122 -
 123
123 -
 124
124 -
 125
125 -
 126
126 -
 127
127 -
 128
128 -
 129
129 -
 130
130
 |
 |
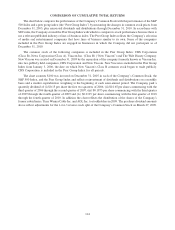
COMPARISON OF CUMULATIVE TOTAL RETURNS
The chart below compares the performance of the Company’s Common Stock with the performance of the S&P
500 Index and a peer group index (the “Peer Group Index”) by measuring the changes in common stock prices from
December 31, 2005, plus reinvested dividends and distributions through December 31, 2010. In accordance with
SEC rules, the Company created the Peer Group Index with which to compare its stock performance because there is
not a relevant published industry or line-of-business index. The Peer Group Index reflects the Company’s selection
of media and entertainment companies that have lines of business similar to its own. Some of the companies
included in the Peer Group Index are engaged in businesses in which the Company did not participate as of
December 31, 2010.
The common stock of the following companies is included in the Peer Group Index: CBS Corporation
(Class B), News Corporation (Class A), Viacom Inc. (Class B) (“New Viacom”) and The Walt Disney Company.
New Viacom was created on December 31, 2005 by the separation of the company formerly known as Viacom Inc.
into two publicly held companies, CBS Corporation and New Viacom. New Viacom is included in the Peer Group
Index from January 3, 2006, the date on which New Viacom’s Class B common stock began to trade publicly.
CBS Corporation is included in the Peer Group Index for all periods.
The chart assumes $100 was invested on December 31, 2005 in each of the Company’s Common Stock, the
S&P 500 Index, and the Peer Group Index and reflects reinvestment of dividends and distributions on a monthly
basis and a market capitalization weighting at the beginning of each semi-annual period. The Company paid a
quarterly dividend of (i) $0.15 per share the first two quarters of 2006, (ii) $0.165 per share commencing with the
third quarter of 2006 through the second quarter of 2007, (iii) $0.1875 per share commencing with the third quarter
of 2007 through the fourth quarter of 2009 and (iv) $0.2125 per share commencing with the first quarter of 2010
through the fourth quarter of 2010. In addition the chart reflects the distribution of the shares of the Company’s
former subsidiaries, Time Warner Cable Inc. and AOL Inc. to stockholders in 2009. The per share dividend amounts
above reflect adjustments for the 1-for-3 reverse stock split of the Company’s Common Stock on March 27, 2009.
114