The Hartford 2013 Annual Report Download - page 83
Download and view the complete annual report
Please find page 83 of the 2013 The Hartford annual report below. You can navigate through the pages in the report by either clicking on the pages listed below, or by using the keyword search tool below to find specific information within the annual report.-
 1
1 -
2
-
3
-
4
-
5
-
6
-
7
-
8
-
9
-
10
-
11
-
12
-
13
-
14
-
15
-
16
-
17
-
18
-
19
-
20
-
21
-
22
-
23
-
24
-
25
-
26
-
27
-
28
-
29
-
30
-
31
-
32
-
33
-
34
-
35
-
36
-
37
-
38
-
39
-
40
-
41
-
42
-
43
-
44
-
45
-
46
-
47
-
48
-
49
-
50
-
51
-
52
-
53
-
54
-
55
-
56
-
57
-
58
-
59
-
60
-
61
-
62
-
63
-
64
-
65
-
66
-
67
-
68
-
69
-
70
-
71
-
72
-
 73
73 -
 74
74 -
 75
75 -
 76
76 -
 77
77 -
 78
78 -
 79
79 -
 80
80 -
 81
81 -
 82
82 -
 83
83 -
 84
84 -
 85
85 -
 86
86 -
 87
87 -
 88
88 -
 89
89 -
 90
90 -
 91
91 -
 92
92 -
 93
93 -
94
-
95
-
96
-
97
-
98
-
99
-
100
-
101
-
102
-
103
-
104
-
105
-
106
-
107
-
108
-
109
-
110
-
111
-
112
-
113
-
114
-
115
-
116
-
117
-
118
-
119
-
120
-
121
-
122
-
123
-
124
-
125
-
126
-
127
-
128
-
129
-
130
-
131
-
132
-
133
-
134
-
135
-
136
-
137
-
138
-
139
-
140
-
141
-
142
-
143
-
144
-
145
-
146
-
147
-
148
-
149
-
150
-
151
-
152
-
153
-
154
-
155
-
156
-
157
-
158
-
159
-
160
-
161
-
162
-
163
-
164
-
165
-
166
-
167
-
168
-
169
-
170
-
171
-
172
-
173
-
174
-
175
-
176
-
177
-
178
-
179
-
180
-
181
-
182
-
183
-
184
-
185
-
186
-
187
-
188
-
189
-
190
-
191
-
192
-
193
-
194
-
195
-
196
-
197
-
198
-
199
-
200
-
201
-
202
-
203
-
204
-
205
-
206
-
207
-
208
-
209
-
210
-
211
-
212
-
213
-
214
-
215
-
216
-
217
-
218
-
219
-
220
-
221
-
222
-
223
-
224
-
225
-
226
-
227
-
228
-
229
-
230
-
231
-
232
-
233
-
234
-
235
-
236
-
237
-
238
-
239
-
240
-
241
-
242
-
243
-
244
-
245
-
246
-
247
-
248
-
249
-
250
 |
 |
83
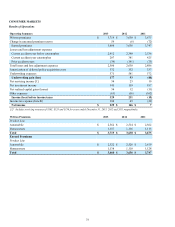
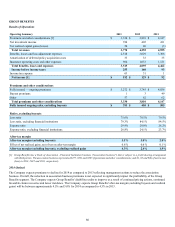
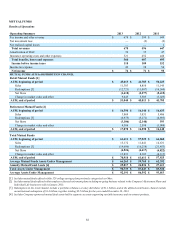
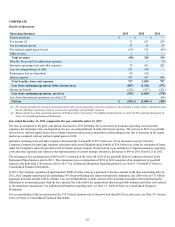
MUTUAL FUNDS AUM by ASSET CLASS 2013 2012 2011
Equity 42,426 35,843 35,489
Fixed Income 14,632 14,524 13,064
Multi-Strategy Investments 13,860 11,244 9,372
Total Mutual Funds AUM, end of period $ 70,918 $ 61,611 $ 57,925
RETURN ON ASSETS
ROA 8.2 8.2 10.5
Effect of restructuring, net of tax (0.2)(0.3) —
Effect of net realized gains, net of tax and DAC (0.1) — —
ROA, core earnings 8.5 8.5 10.5
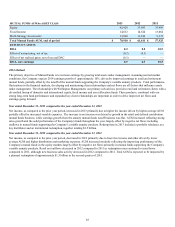
2014 Outlook
The primary objective of Mutual Funds is to increase earnings by growing total assets under management. Assuming normal market
conditions, the Company expects 2014 earnings growth of approximately 10%, driven by improved earnings in retail and retirement
mutual funds, partially offset by the runoff of the mutual funds supporting the Company's variable annuity products. Fund performance,
fluctuations in the financial markets, developing and maintaining client relationships and net flows are all factors that influence assets
under management. The relationship with Wellington Management, our primary sub-advisor, provides retail and retirement clients with a
diversified lineup of domestic and international equity, fixed income and asset allocation funds. These products, combined with our
strong long-term fund performance and expanded key client relationships are important in order to drive improved net flows and
earnings going forward.
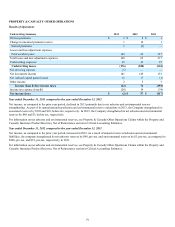
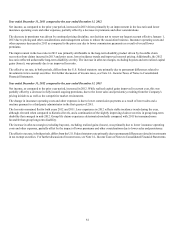
Year ended December 31, 2013 compared to the year ended December 31, 2012
Net income, as compared to the prior year period, increased in 2013 primarily due to higher fee income driven by higher average AUM
partially offset by increased variable expenses. The increase in net income was driven by growth in the retail and defined contribution
mutual funds business, while earnings growth from the annuity mutual funds runoff business was flat. AUM increased reflecting strong
sales growth and the solid performance of the Company's funds throughout the year, largely offset by negative net flows including
outflows in mutual funds supporting the Company's variable annuity products. Redemptions in 2013 included a portfolio rebalance at a
key distributor and an institutional redemption, together totaling $2.5 billion.
Year ended December 31, 2012 compared to the year ended December 31, 2011
Net income, as compared to the prior year period, decreased in 2012 primarily due to lower fee income and other driven by lower
average AUM and higher distribution and marketing expenses. AUM increased modestly reflecting the improving performance of the
Company's mutual funds in the equity markets largely offset by negative net flows primarily in mutual funds supporting the Company's
variable annuity products. Retail net outflows decreased in 2012 compared to 2011 as redemption rates continued to trend lower
compared to 2011, although new business sales activity decreased in 2012 compared to 2011. Total AUM is expected to be impacted by
a planned redemption of approximately $1.5 billion in the second quarter of 2013.