The Hartford 2013 Annual Report Download - page 194
Download and view the complete annual report
Please find page 194 of the 2013 The Hartford annual report below. You can navigate through the pages in the report by either clicking on the pages listed below, or by using the keyword search tool below to find specific information within the annual report.-
 1
1 -
2
-
3
-
4
-
5
-
6
-
7
-
8
-
9
-
10
-
11
-
12
-
13
-
14
-
15
-
16
-
17
-
18
-
19
-
20
-
21
-
22
-
23
-
24
-
25
-
26
-
27
-
28
-
29
-
30
-
31
-
32
-
33
-
34
-
35
-
36
-
37
-
38
-
39
-
40
-
41
-
42
-
43
-
44
-
45
-
46
-
47
-
48
-
49
-
50
-
51
-
52
-
53
-
54
-
55
-
56
-
57
-
58
-
59
-
60
-
61
-
62
-
63
-
64
-
65
-
66
-
67
-
68
-
69
-
70
-
71
-
72
-
73
-
74
-
75
-
76
-
77
-
78
-
79
-
80
-
81
-
82
-
83
-
84
-
85
-
86
-
87
-
88
-
89
-
90
-
91
-
92
-
93
-
94
-
95
-
96
-
97
-
98
-
99
-
100
-
101
-
102
-
103
-
104
-
105
-
106
-
107
-
108
-
109
-
110
-
111
-
112
-
113
-
114
-
115
-
116
-
117
-
118
-
119
-
120
-
121
-
122
-
123
-
124
-
125
-
126
-
127
-
128
-
129
-
130
-
131
-
132
-
133
-
134
-
135
-
136
-
137
-
138
-
139
-
140
-
141
-
142
-
143
-
144
-
145
-
146
-
147
-
148
-
149
-
150
-
151
-
152
-
153
-
154
-
155
-
156
-
157
-
158
-
159
-
160
-
161
-
162
-
163
-
164
-
165
-
166
-
167
-
168
-
169
-
170
-
171
-
172
-
173
-
174
-
175
-
176
-
177
-
178
-
179
-
180
-
181
-
182
-
183
-
 184
184 -
 185
185 -
 186
186 -
 187
187 -
 188
188 -
 189
189 -
 190
190 -
 191
191 -
 192
192 -
 193
193 -
 194
194 -
 195
195 -
 196
196 -
 197
197 -
 198
198 -
 199
199 -
 200
200 -
 201
201 -
 202
202 -
 203
203 -
 204
204 -
205
-
206
-
207
-
208
-
209
-
210
-
211
-
212
-
213
-
214
-
215
-
216
-
217
-
218
-
219
-
220
-
221
-
222
-
223
-
224
-
225
-
226
-
227
-
228
-
229
-
230
-
231
-
232
-
233
-
234
-
235
-
236
-
237
-
238
-
239
-
240
-
241
-
242
-
243
-
244
-
245
-
246
-
247
-
248
-
249
-
250
 |
 |

F-58
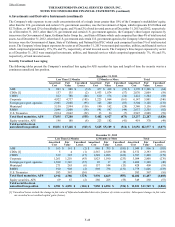
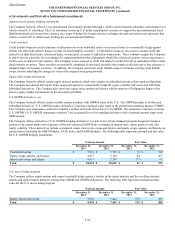
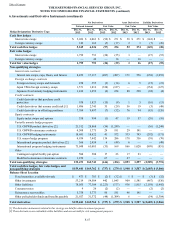
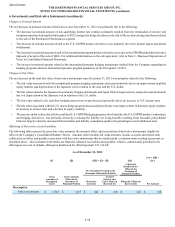
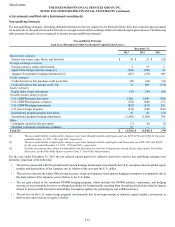
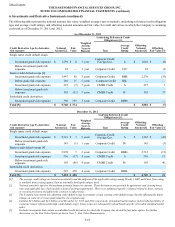
Change in Notional Amount
The net decrease in notional amount of derivatives since December 31, 2012 was primarily due to the following:
• The decrease in notional amount of non-qualifying interest rate contracts primarily resulted from the termination of interest rate
swaptions purchased during the third quarter of 2012 designed to hedge the interest rate risk of the securities being transferred related
to the sale of the Retirement Plan business segment.
• The decrease in notional amount related to the U.S. GMWB product derivatives was primarily driven by product lapses and partial
withdrawals.
• The decrease in notional amount related to the international program product derivatives was due to the GWMB embedded derivative
disposed of as part of the sale of HLIL. For additional information on the sale agreement, refer to Note 2 - Business Dispositions of
Notes to Consolidated Financial Statements.
• The increase in notional amount related to the international program hedging instruments resulted from the Company expanding its
hedging program related to international product program guarantees in the first quarter of 2013.
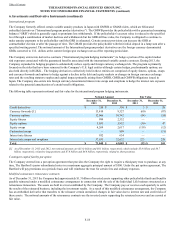
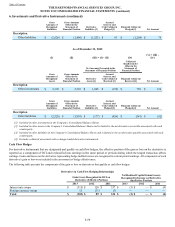
Change in Fair Value
The net decrease in the total fair value of derivative instruments since December 31, 2012 was primarily related to the following:
• The fair value associated with the international program hedging instruments decreased primarily due to an improvement in global
equity markets and depreciation of the Japanese yen in relation to the euro and the U.S. dollar.
• The fair value related to the Japanese fixed annuity hedging instruments and Japan 3Win foreign currency swaps decreased primarily
due to a depreciation of the Japanese yen in relation to the U.S. dollar.
• The fair value related to the cash flow hedging interest rate swaps decreased primarily due to an increase in U.S. interest rates.
• The fair value associated with the U.S. macro hedge program decreased primarily due to an improvement in domestic equity markets,
an increase in interest rates and a decline in equity volatility.
• The increase in fair value related to the combined U.S. GMWB hedging program, which includes the U.S. GMWB product, reinsurance
and hedging derivatives, was primarily driven by revaluing the liability for living benefits resulting from favorable policyholder
behavior largely related to increased full surrenders and liability assumption updates for partial lapses and withdrawal rates.
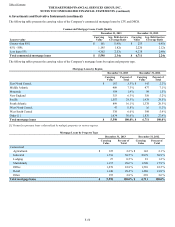
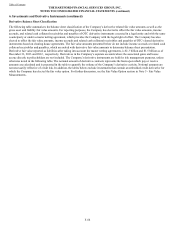
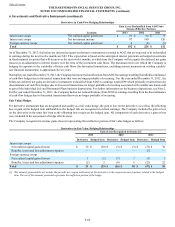
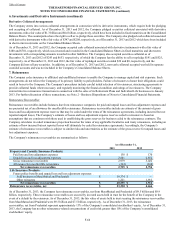
Offsetting of Derivative Assets/Liabilities
The following tables present the gross fair value amounts, the amounts offset, and net position of derivative instruments eligible for
offset in the Company's Consolidated Balance Sheets. Amounts offset include fair value amounts, income accruals and related cash
collateral receivables and payables associated with derivative instruments that are traded under a common master netting agreement, as
described above. Also included in the tables are financial collateral receivables and payables, which is contractually permitted to be
offset upon an event of default, although is disallowed for offsetting under U.S. GAAP.
As of December 31, 2013
(i) (ii) (iii) = (i) - (ii) (iv) (v) = (iii) -
(iv)
Net Amounts Presented in the
Statement of Financial Position
Collateral
Disallowed for
Offset in the
Statement of
Financial Position
Gross
Amounts of
Recognized
Assets
Gross Amounts
Offset in the
Statement of
Financial Position Derivative
Assets [1]
Accrued
Interest and
Cash Collateral
Received [2] Financial Collateral
Received [4] Net Amount
Description
Other investments $ 1,845 $ 1,463 $ 442 $ (60) $ 242 $ 140
Table of Contents THE HARTFORD FINANCIAL SERVICES GROUP, INC.
NOTES TO CONSOLIDATED FINANCIAL STATEMENTS (continued)
6. Investments and Derivative Instruments (continued)