The Hartford 2013 Annual Report Download - page 236
Download and view the complete annual report
Please find page 236 of the 2013 The Hartford annual report below. You can navigate through the pages in the report by either clicking on the pages listed below, or by using the keyword search tool below to find specific information within the annual report.-
 1
1 -
2
-
3
-
4
-
5
-
6
-
7
-
8
-
9
-
10
-
11
-
12
-
13
-
14
-
15
-
16
-
17
-
18
-
19
-
20
-
21
-
22
-
23
-
24
-
25
-
26
-
27
-
28
-
29
-
30
-
31
-
32
-
33
-
34
-
35
-
36
-
37
-
38
-
39
-
40
-
41
-
42
-
43
-
44
-
45
-
46
-
47
-
48
-
49
-
50
-
51
-
52
-
53
-
54
-
55
-
56
-
57
-
58
-
59
-
60
-
61
-
62
-
63
-
64
-
65
-
66
-
67
-
68
-
69
-
70
-
71
-
72
-
73
-
74
-
75
-
76
-
77
-
78
-
79
-
80
-
81
-
82
-
83
-
84
-
85
-
86
-
87
-
88
-
89
-
90
-
91
-
92
-
93
-
94
-
95
-
96
-
97
-
98
-
99
-
100
-
101
-
102
-
103
-
104
-
105
-
106
-
107
-
108
-
109
-
110
-
111
-
112
-
113
-
114
-
115
-
116
-
117
-
118
-
119
-
120
-
121
-
122
-
123
-
124
-
125
-
126
-
127
-
128
-
129
-
130
-
131
-
132
-
133
-
134
-
135
-
136
-
137
-
138
-
139
-
140
-
141
-
142
-
143
-
144
-
145
-
146
-
147
-
148
-
149
-
150
-
151
-
152
-
153
-
154
-
155
-
156
-
157
-
158
-
159
-
160
-
161
-
162
-
163
-
164
-
165
-
166
-
167
-
168
-
169
-
170
-
171
-
172
-
173
-
174
-
175
-
176
-
177
-
178
-
179
-
180
-
181
-
182
-
183
-
184
-
185
-
186
-
187
-
188
-
189
-
190
-
191
-
192
-
193
-
194
-
195
-
196
-
197
-
198
-
199
-
200
-
201
-
202
-
203
-
204
-
205
-
206
-
207
-
208
-
209
-
210
-
211
-
212
-
213
-
214
-
215
-
216
-
217
-
218
-
219
-
220
-
221
-
222
-
223
-
224
-
225
-
 226
226 -
 227
227 -
 228
228 -
 229
229 -
 230
230 -
 231
231 -
 232
232 -
 233
233 -
 234
234 -
 235
235 -
 236
236 -
 237
237 -
 238
238 -
 239
239 -
 240
240 -
 241
241 -
 242
242 -
 243
243 -
 244
244 -
 245
245 -
 246
246 -
247
-
248
-
249
-
250
 |
 |
F-100
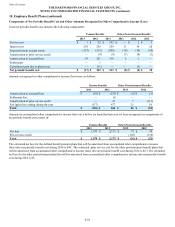
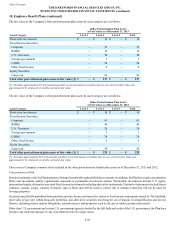
Employee Stock Purchase Plan
In 1996, the Company established The Hartford Employee Stock Purchase Plan (“ESPP”). Under this plan, eligible employees of The
Hartford purchase common stock of the Company at a discount rate of 5% of the market price per share on the last trading day of the
offering period. In 2009 and prior years, eligible employees of The Hartford purchased common stock of the Company at a 15%
discount from the lower of the closing market price at the beginning or end of the offering period. Employees purchase a variable
number of shares of stock through payroll deductions elected as of the beginning of the offering period. The Company may sell up to
15,400,000 shares of stock to eligible employees under the ESPP. As of December 31, 2013, there were 5,476,032 shares available for
future issuance. During the years ended 2013, 2012 and 2011, 321,723, 688,655, and 768,380 shares were sold, respectively. The
weighted average per share fair value of the discount under the ESPP was $1.52, $1.00 and $1.03 during the years ended 2013 , 2012
and 2011, respectively. In 2013, 2012, and 2011, the fair value is estimated based on the 5% discount off the market price per share on
the last trading day of the offering period.
Additionally, The Hartford has established employee stock purchase sub-plans for certain employees of the Company's international
subsidiaries. Under these sub-plans, participants may purchase common stock of The Hartford at a fixed price. The activity under these
programs is not material.
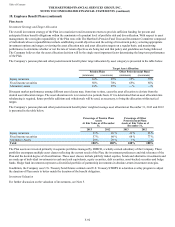
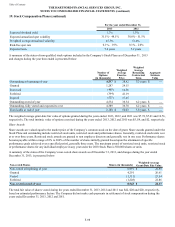
20. Discontinued Operations
On December 12, 2013, the Company completed the sale of HLIL, an indirect wholly-owned subsidiary. For further information
regarding the sale of HLIL, see Note 2 - Business Dispositions of Notes to Consolidated Financial Statements.
On November 1, 2011, the Company completed a merger with CenterState Banks, Inc. (“CBI”), pursuant to which Federal Trust Corporation
(“FTC”), a wholly owned subsidiary of the Company, was merged with and into CBI, and Federal Trust Bank (“FTB”), a federally chartered,
FDIC-insured thrift and wholly owned subsidiary of FTC, was merged with and into CenterState Bank of Florida, N.A. (“CenterState
Bank”), a wholly owned subsidiary of CBI. The Company recorded an after-tax charge of $74 to net realized capital losses in the second
quarter of 2011 for the estimated loss on disposal, including the write off of remaining goodwill of $10, after-tax, and losses on certain FTC
and FTB assets and liabilities, which were not transferred to CenterState Bank. Upon final closing with CBI, the Company recorded a
benefit of $6, after tax, in the fourth quarter of 2011 related to the divestiture.
In the first quarter of 2011, the Company completed the sale of its wholly-owned subsidiary Specialty Risk Services (“SRS”) and recorded
a net realized capital gain of $150, after-tax. SRS is a third-party claims administration business that provides self-insured, insured, and
alternative market clients with customized claims services.
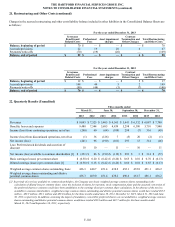
The following table summarizes the amounts related to discontinued operations in the Consolidated Statements of Operations.
For the years ended December 31,
2013 2012 2011
Revenues
Earned premiums $ 4 $ — $ —
Fee income and other 13 46 50
Net investment income (loss)
Securities available-for-sale and other (3) 10 26
Equity securities, trading 140 201 (14)
Total Net Investment Income 137 211 12
Net realized capital losses (49) 33 75
Other revenues — — 48
Total revenues 105 290 185
Benefits, losses and expenses
Benefits, losses and loss adjustment expenses 2 2 (2)
Benefits, losses and loss adjustment expenses - returns credited on international variable annuities 140 201 (14)
Amortization of DAC — — —
Insurance operating costs and other expenses 23 39 95
Total benefits, losses and expenses 165 242 79
Income (loss) before income taxes (60) 48 106
Income tax expense (benefit) (28) (15) 49
Income (loss) from operations of discontinued operations, net of tax (32) 63 57
Net realized capital gain (loss) on disposal, net of tax [1] (102) (1) 82
Income (loss) from discontinued operations, net of tax $ (134) $ 62 $ 139
[1] Includes an income tax benefit of $219 on the sale of HLIL for the year ended December 31, 2013.
Table of Contents THE HARTFORD FINANCIAL SERVICES GROUP, INC.
NOTES TO CONSOLIDATED FINANCIAL STATEMENTS (continued)
19. Stock Compensation Plans (continued)