The Hartford 2013 Annual Report Download - page 110
Download and view the complete annual report
Please find page 110 of the 2013 The Hartford annual report below. You can navigate through the pages in the report by either clicking on the pages listed below, or by using the keyword search tool below to find specific information within the annual report.-
 1
1 -
2
-
3
-
4
-
5
-
6
-
7
-
8
-
9
-
10
-
11
-
12
-
13
-
14
-
15
-
16
-
17
-
18
-
19
-
20
-
21
-
22
-
23
-
24
-
25
-
26
-
27
-
28
-
29
-
30
-
31
-
32
-
33
-
34
-
35
-
36
-
37
-
38
-
39
-
40
-
41
-
42
-
43
-
44
-
45
-
46
-
47
-
48
-
49
-
50
-
51
-
52
-
53
-
54
-
55
-
56
-
57
-
58
-
59
-
60
-
61
-
62
-
63
-
64
-
65
-
66
-
67
-
68
-
69
-
70
-
71
-
72
-
73
-
74
-
75
-
76
-
77
-
78
-
79
-
80
-
81
-
82
-
83
-
84
-
85
-
86
-
87
-
88
-
89
-
90
-
91
-
92
-
93
-
94
-
95
-
96
-
97
-
98
-
99
-
 100
100 -
 101
101 -
 102
102 -
 103
103 -
 104
104 -
 105
105 -
 106
106 -
 107
107 -
 108
108 -
 109
109 -
 110
110 -
 111
111 -
 112
112 -
 113
113 -
 114
114 -
 115
115 -
 116
116 -
 117
117 -
 118
118 -
 119
119 -
 120
120 -
121
-
122
-
123
-
124
-
125
-
126
-
127
-
128
-
129
-
130
-
131
-
132
-
133
-
134
-
135
-
136
-
137
-
138
-
139
-
140
-
141
-
142
-
143
-
144
-
145
-
146
-
147
-
148
-
149
-
150
-
151
-
152
-
153
-
154
-
155
-
156
-
157
-
158
-
159
-
160
-
161
-
162
-
163
-
164
-
165
-
166
-
167
-
168
-
169
-
170
-
171
-
172
-
173
-
174
-
175
-
176
-
177
-
178
-
179
-
180
-
181
-
182
-
183
-
184
-
185
-
186
-
187
-
188
-
189
-
190
-
191
-
192
-
193
-
194
-
195
-
196
-
197
-
198
-
199
-
200
-
201
-
202
-
203
-
204
-
205
-
206
-
207
-
208
-
209
-
210
-
211
-
212
-
213
-
214
-
215
-
216
-
217
-
218
-
219
-
220
-
221
-
222
-
223
-
224
-
225
-
226
-
227
-
228
-
229
-
230
-
231
-
232
-
233
-
234
-
235
-
236
-
237
-
238
-
239
-
240
-
241
-
242
-
243
-
244
-
245
-
246
-
247
-
248
-
249
-
250
 |
 |
110
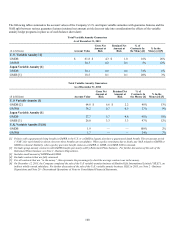
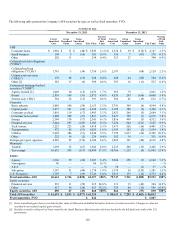
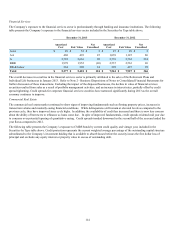
The following table presents the Company’s AFS securities by type, as well as fixed maturities, FVO.
Securities by Type
December 31, 2013 December 31, 2012
Cost or
Amortized
Cost
Gross
Unrealized
Gains
Gross
Unrealized
Losses Fair Value
Percent
of Total
Fair
Value
Cost or
Amortized
Cost
Gross
Unrealized
Gains
Gross
Unrealized
Losses Fair Value
Percent
of Total
Fair
Value
ABS
Consumer loans $ 1,982 $ 11 $ (48) $ 1,945 3.1 % $ 2,234 $ 29 $ (116) $ 2,147 2.5%
Small business 194 3 (16) 181 0.3% 336 7 (67) 276 0.3%
Other 228 11 — 239 0.4 % 313 27 — 340 0.4%
Collateralized debt obligations
("CDOs")
Collateralized loan
obligations (“CLOs”) 1,781 3 (34) 1,750 2.8 % 2,197 — (68) 2,129 2.5 %
Commercial real estate
("CREs") 176 88 (16) 248 0.4 % 420 44 (80) 384 0.4 %
Other [1] 383 17 (9) 389 0.6% 553 16 (11) 527 0.6%
Commercial mortgage-backed
securities ("CMBS")
Agency backed [2] 1,068 20 (12) 1,076 1.7% 962 79 — 1,041 1.2%
Bonds 2,836 168 (31) 2,973 4.8 % 4,535 293 (160) 4,668 5.4 %
Interest only (“IOs”) 384 28 (15) 397 0.6 % 586 45 (19) 612 0.7%
Corporate
Basic industry 2,085 106 (38) 2,153 3.5% 3,741 369 (6) 4,104 4.8%
Capital goods 2,077 161 (14) 2,224 3.6 % 3,109 389 (2) 3,496 4.1%
Consumer cyclical 1,801 119 (17) 1,903 3.1% 2,423 266 (5) 2,684 3.1%
Consumer non-cyclical 3,600 288 (21) 3,867 6.2% 5,927 759 (7) 6,679 7.8%
Energy 2,384 174 (17) 2,541 4.1 % 3,816 499 (3) 4,312 5.0 %
Financial services 5,044 287 (145) 5,186 8.3% 7,230 604 (211) 7,623 8.9%
Tech./comm. 3,223 223 (28) 3,418 5.5 % 3,971 526 (16) 4,481 5.2 %
Transportation 972 65 (13) 1,024 1.6 % 1,393 163 (2) 1,554 1.8 %
Utilities 5,605 386 (51) 5,940 9.5 % 7,792 1,017 (24) 8,785 10.2 %
Other 222 14 (2) 234 0.4% 292 39 — 331 0.4%
Foreign govt./govt. agencies 4,228 52 (176) 4,104 6.6% 3,985 191 (40) 4,136 4.8 %
Municipal
Taxable 1,299 32 (67) 1,264 2.0 % 2,235 246 (15) 2,466 2.9 %
Tax-exempt 10,633 393 (117) 10,909 17.5 % 10,766 1,133 (4) 11,895 13.9 %
RMBS
Agency 3,366 59 (38) 3,387 5.4 % 5,906 259 (3) 6,162 7.2 %
Non-agency 86 — — 86 0.1% — — — — — %
Alt-A — — — — — % 38 — (1) 37 —%
Sub-prime 1,187 31 (44) 1,174 1.9 % 1,374 36 (129) 1,281 1.5 %
U.S. Treasuries 3,797 7 (59) 3,745 6.0% 3,613 175 (16) 3,772 4.4%
Fixed maturities, AFS 60,641 2,746 (1,028) 62,357 100% 79,747 7,211 (1,005) 85,922 100%
Equity securities
Financial services 233 11 (29) 215 24.8 % 331 15 (42) 304 34.2 %
Other 617 56 (20) 653 75.2 % 535 66 (15) 586 65.8 %
Equity securities, AFS 850 67 (49) 868 100% 866 81 (57) 890 100%
Total AFS securities $ 61,491 $ 2,813 $ (1,077) $ 63,225 $ 80,613 $ 7,292 $ (1,062) $ 86,812
Fixed maturities, FVO $ 844 $ 1,087
[1] Gross unrealized gains (losses) exclude the fair value of bifurcated embedded derivative features of certain securities. Changes in value are
recorded in net realized capital gains (losses).
[2] Includes securities with pools of loans issued by the Small Business Administration which are backed by the full faith and credit of the U.S.
government.