The Hartford 2013 Annual Report Download - page 170
Download and view the complete annual report
Please find page 170 of the 2013 The Hartford annual report below. You can navigate through the pages in the report by either clicking on the pages listed below, or by using the keyword search tool below to find specific information within the annual report.-
 1
1 -
2
-
3
-
4
-
5
-
6
-
7
-
8
-
9
-
10
-
11
-
12
-
13
-
14
-
15
-
16
-
17
-
18
-
19
-
20
-
21
-
22
-
23
-
24
-
25
-
26
-
27
-
28
-
29
-
30
-
31
-
32
-
33
-
34
-
35
-
36
-
37
-
38
-
39
-
40
-
41
-
42
-
43
-
44
-
45
-
46
-
47
-
48
-
49
-
50
-
51
-
52
-
53
-
54
-
55
-
56
-
57
-
58
-
59
-
60
-
61
-
62
-
63
-
64
-
65
-
66
-
67
-
68
-
69
-
70
-
71
-
72
-
73
-
74
-
75
-
76
-
77
-
78
-
79
-
80
-
81
-
82
-
83
-
84
-
85
-
86
-
87
-
88
-
89
-
90
-
91
-
92
-
93
-
94
-
95
-
96
-
97
-
98
-
99
-
100
-
101
-
102
-
103
-
104
-
105
-
106
-
107
-
108
-
109
-
110
-
111
-
112
-
113
-
114
-
115
-
116
-
117
-
118
-
119
-
120
-
121
-
122
-
123
-
124
-
125
-
126
-
127
-
128
-
129
-
130
-
131
-
132
-
133
-
134
-
135
-
136
-
137
-
138
-
139
-
140
-
141
-
142
-
143
-
144
-
145
-
146
-
147
-
148
-
149
-
150
-
151
-
152
-
153
-
154
-
155
-
156
-
157
-
158
-
159
-
 160
160 -
 161
161 -
 162
162 -
 163
163 -
 164
164 -
 165
165 -
 166
166 -
 167
167 -
 168
168 -
 169
169 -
 170
170 -
 171
171 -
 172
172 -
 173
173 -
 174
174 -
 175
175 -
 176
176 -
 177
177 -
 178
178 -
 179
179 -
 180
180 -
181
-
182
-
183
-
184
-
185
-
186
-
187
-
188
-
189
-
190
-
191
-
192
-
193
-
194
-
195
-
196
-
197
-
198
-
199
-
200
-
201
-
202
-
203
-
204
-
205
-
206
-
207
-
208
-
209
-
210
-
211
-
212
-
213
-
214
-
215
-
216
-
217
-
218
-
219
-
220
-
221
-
222
-
223
-
224
-
225
-
226
-
227
-
228
-
229
-
230
-
231
-
232
-
233
-
234
-
235
-
236
-
237
-
238
-
239
-
240
-
241
-
242
-
243
-
244
-
245
-
246
-
247
-
248
-
249
-
250
 |
 |
F-34
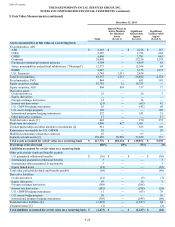
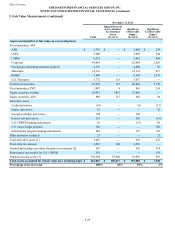
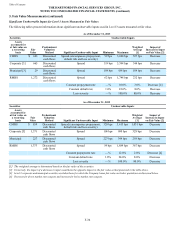
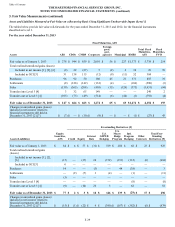
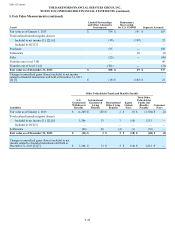
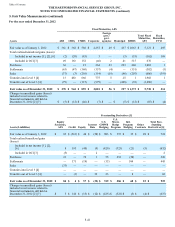
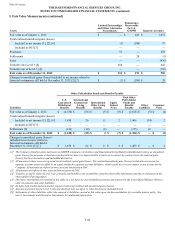
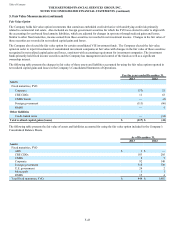
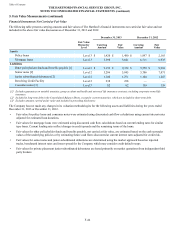
Significant Unobservable Inputs for Level 3 Assets Measured at Fair Values
The following tables present information about significant unobservable inputs used in Level 3 assets measured at fair value.
As of December 31, 2013
Securities Unobservable Inputs
Assets
accounted for
at fair value on
a recurring
basis Fair
Value
Predominant
Valuation
Method Significant Unobservable Input Minimum Maximum
Weighted
Average
[1]
Impact of
Increase in Input
on Fair Value [2]
CMBS $ 663 Discounted
cash flows Spread (encompasses prepayment,
default risk and loss severity) 99 bps 3,000 bps 527 bps Decrease
Corporate [3] 665 Discounted
cash flows Spread 119 bps 5,594 bps 344 bps Decrease
Municipal [3] 29 Discounted
cash flows Spread 184 bps 184 bps 184 bps Decrease
RMBS 1,272 Discounted
cash flows Spread 62 bps 1,748 bps 232 bps Decrease
Constant prepayment rate —% 10.0% 3.0% Decrease [4]
Constant default rate 1.0% 22.0% 8.0% Decrease
Loss severity —% 100.0% 80.0% Decrease
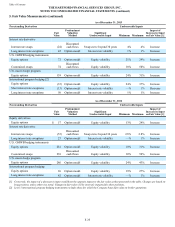
As of December 31, 2012
Securities Unobservable Inputs
Assets
accounted for
at fair value on
a recurring
basis Fair
Value
Predominant
Valuation
Method Significant Unobservable Input Minimum Maximum
Weighted
Average
[1]
Impact of
Increase in Input
on Fair Value [2]
CMBS $ 859 Discounted
cash flows Spread (encompasses prepayment,
default risk and loss severity) 320 bps 3,615 bps 1,031 bps Decrease
Corporate [3] 1,371 Discounted
cash flows Spread 106 bps 900 bps 328 bps Decrease
Municipal 227 Discounted
cash flows Spread 227 bps 344 bps 258 bps Decrease
RMBS 1,373 Discounted
cash flows Spread 54 bps 1,689 bps 367 bps Decrease
Constant prepayment rate —% 12.0% 2.0% Decrease [4]
Constant default rate 1.0% 24.0% 8.0% Decrease
Loss severity —% 100.0% 80.0% Decrease
[1] The weighted average is determined based on the fair value of the securities.
[2] Conversely, the impact of a decrease in input would have the opposite impact to the fair value as that presented in the table above.
[3] Level 3 corporate and municipal securities excludes those for which the Company bases fair value on broker quotations as discussed below.
[4] Decrease for above market rate coupons and increase for below market rate coupons.
Table of Contents THE HARTFORD FINANCIAL SERVICES GROUP, INC.
NOTES TO CONSOLIDATED FINANCIAL STATEMENTS (continued)
5. Fair Value Measurements (continued)