The Hartford 2013 Annual Report Download - page 120
Download and view the complete annual report
Please find page 120 of the 2013 The Hartford annual report below. You can navigate through the pages in the report by either clicking on the pages listed below, or by using the keyword search tool below to find specific information within the annual report.-
 1
1 -
2
-
3
-
4
-
5
-
6
-
7
-
8
-
9
-
10
-
11
-
12
-
13
-
14
-
15
-
16
-
17
-
18
-
19
-
20
-
21
-
22
-
23
-
24
-
25
-
26
-
27
-
28
-
29
-
30
-
31
-
32
-
33
-
34
-
35
-
36
-
37
-
38
-
39
-
40
-
41
-
42
-
43
-
44
-
45
-
46
-
47
-
48
-
49
-
50
-
51
-
52
-
53
-
54
-
55
-
56
-
57
-
58
-
59
-
60
-
61
-
62
-
63
-
64
-
65
-
66
-
67
-
68
-
69
-
70
-
71
-
72
-
73
-
74
-
75
-
76
-
77
-
78
-
79
-
80
-
81
-
82
-
83
-
84
-
85
-
86
-
87
-
88
-
89
-
90
-
91
-
92
-
93
-
94
-
95
-
96
-
97
-
98
-
99
-
100
-
101
-
102
-
103
-
104
-
105
-
106
-
107
-
108
-
109
-
 110
110 -
 111
111 -
 112
112 -
 113
113 -
 114
114 -
 115
115 -
 116
116 -
 117
117 -
 118
118 -
 119
119 -
 120
120 -
 121
121 -
 122
122 -
 123
123 -
 124
124 -
 125
125 -
 126
126 -
 127
127 -
 128
128 -
 129
129 -
 130
130 -
131
-
132
-
133
-
134
-
135
-
136
-
137
-
138
-
139
-
140
-
141
-
142
-
143
-
144
-
145
-
146
-
147
-
148
-
149
-
150
-
151
-
152
-
153
-
154
-
155
-
156
-
157
-
158
-
159
-
160
-
161
-
162
-
163
-
164
-
165
-
166
-
167
-
168
-
169
-
170
-
171
-
172
-
173
-
174
-
175
-
176
-
177
-
178
-
179
-
180
-
181
-
182
-
183
-
184
-
185
-
186
-
187
-
188
-
189
-
190
-
191
-
192
-
193
-
194
-
195
-
196
-
197
-
198
-
199
-
200
-
201
-
202
-
203
-
204
-
205
-
206
-
207
-
208
-
209
-
210
-
211
-
212
-
213
-
214
-
215
-
216
-
217
-
218
-
219
-
220
-
221
-
222
-
223
-
224
-
225
-
226
-
227
-
228
-
229
-
230
-
231
-
232
-
233
-
234
-
235
-
236
-
237
-
238
-
239
-
240
-
241
-
242
-
243
-
244
-
245
-
246
-
247
-
248
-
249
-
250
 |
 |
120
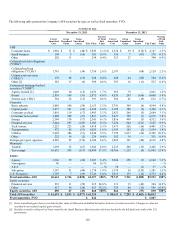
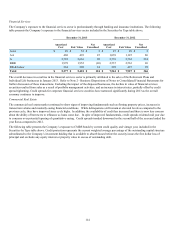
Future impairments may develop as the result of changes in intent to sell specific securities or if actual results underperform current
modeling assumptions, which may be the result of, but are not limited to, macroeconomic factors and security-specific performance
below current expectations. Ultimate loss formation will be a function of macroeconomic factors and idiosyncratic security-specific
performance.
Year ended December 31, 2012
For the year ended December 31, 2012, impairments recognized in earnings were comprised of intent-to-sell impairments of $238,
which included $177 related to the sale of the Retirement Plans and Individual Life businesses. Also included were impairments on
equity securities of $63 largely comprised of downgraded preferred equity securities of financial institutions. The Company's credit
impairments totaled $48, primarily concentrated in structured securities associated with residential and commercial real estate, as well as
ABS small business.
Year ended December 31, 2011
For the year ended December 31, 2011, impairments recognized in earnings were comprised of credit impairments of $125, primarily
concentrated on structured securities associated with commercial real estate, as well as direct private investments. Also included were
impairments on debt securities for which the Company intended to sell of $32, mainly comprised of corporate bonds, certain ABS
aircraft bonds and CMBS, as market pricing improved, as well as impairments on equity securities of $17 primarily related to preferred
stock associated with direct private investments.
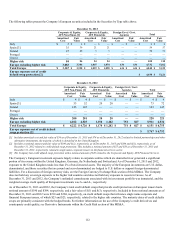
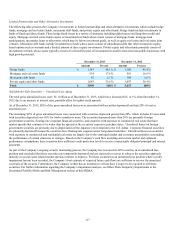
Valuation Allowances on Mortgage Loans
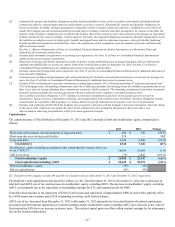
The following table presents (additions)/reversals to valuation allowances on mortgage loans.
For the years ended December 31,
2013 2012 2011
Credit-related concerns $ (2) $ 14 $ 27
Held for sale
Agricultural loans — — (3)
B-note participations — — —
Mezzanine loans — — —
Total $ (2) $ 14 $ 24
Year ended December 31, 2013
For the year ended December 31, 2013, the change in valuation allowances on mortgage loan additions of $(2) was largely driven by
individual property performance. Continued improvement in commercial real estate property valuations will positively impact future
loss development, with future impairments driven by idiosyncratic loan-specific performance, as well as the necessity of risk reduction
in the portfolio, rather than overall deteriorating market fundamentals.
Year ended December 31, 2012
For the year ended December 31, 2012, the change in valuation allowances on mortgage loan reversals of $14 was largely driven by
recovery of the property collateralizing a B-Note. The valuation allowance was reversed due to an increase in the valuation of the
underlying collateral as a result of improved occupancy rates and performance of the property.
Year ended December 31, 2011
For the years ended December 31, 2011, the change in valuation allowances on mortgage loan reversals of $24 was largely driven by the
release of a reserve associated with the sale of a previously reserved for mezzanine loan. Excluded from the table above are valuation
allowances associated with mortgage loans related to the divestiture of Federal Trust Corporation. For further information regarding the
divestiture of Federal Trust Corporation, see Note 20 of Notes to the Consolidated Financial Statements.