The Hartford 2013 Annual Report Download - page 39
Download and view the complete annual report
Please find page 39 of the 2013 The Hartford annual report below. You can navigate through the pages in the report by either clicking on the pages listed below, or by using the keyword search tool below to find specific information within the annual report.-
 1
1 -
2
-
3
-
4
-
5
-
6
-
7
-
8
-
9
-
10
-
11
-
12
-
13
-
14
-
15
-
16
-
17
-
18
-
19
-
20
-
21
-
22
-
23
-
24
-
25
-
26
-
27
-
28
-
 29
29 -
 30
30 -
 31
31 -
 32
32 -
 33
33 -
 34
34 -
 35
35 -
 36
36 -
 37
37 -
 38
38 -
 39
39 -
 40
40 -
 41
41 -
 42
42 -
 43
43 -
 44
44 -
 45
45 -
 46
46 -
 47
47 -
 48
48 -
 49
49 -
50
-
51
-
52
-
53
-
54
-
55
-
56
-
57
-
58
-
59
-
60
-
61
-
62
-
63
-
64
-
65
-
66
-
67
-
68
-
69
-
70
-
71
-
72
-
73
-
74
-
75
-
76
-
77
-
78
-
79
-
80
-
81
-
82
-
83
-
84
-
85
-
86
-
87
-
88
-
89
-
90
-
91
-
92
-
93
-
94
-
95
-
96
-
97
-
98
-
99
-
100
-
101
-
102
-
103
-
104
-
105
-
106
-
107
-
108
-
109
-
110
-
111
-
112
-
113
-
114
-
115
-
116
-
117
-
118
-
119
-
120
-
121
-
122
-
123
-
124
-
125
-
126
-
127
-
128
-
129
-
130
-
131
-
132
-
133
-
134
-
135
-
136
-
137
-
138
-
139
-
140
-
141
-
142
-
143
-
144
-
145
-
146
-
147
-
148
-
149
-
150
-
151
-
152
-
153
-
154
-
155
-
156
-
157
-
158
-
159
-
160
-
161
-
162
-
163
-
164
-
165
-
166
-
167
-
168
-
169
-
170
-
171
-
172
-
173
-
174
-
175
-
176
-
177
-
178
-
179
-
180
-
181
-
182
-
183
-
184
-
185
-
186
-
187
-
188
-
189
-
190
-
191
-
192
-
193
-
194
-
195
-
196
-
197
-
198
-
199
-
200
-
201
-
202
-
203
-
204
-
205
-
206
-
207
-
208
-
209
-
210
-
211
-
212
-
213
-
214
-
215
-
216
-
217
-
218
-
219
-
220
-
221
-
222
-
223
-
224
-
225
-
226
-
227
-
228
-
229
-
230
-
231
-
232
-
233
-
234
-
235
-
236
-
237
-
238
-
239
-
240
-
241
-
242
-
243
-
244
-
245
-
246
-
247
-
248
-
249
-
250
 |
 |
39
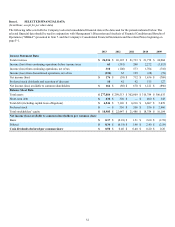
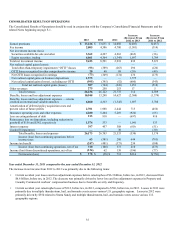
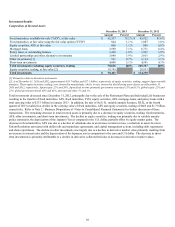
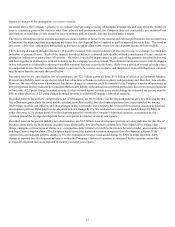
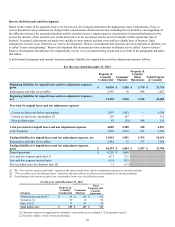
Net Investment Income (Loss)
For the years ended December 31,
2013 2012 2011
(Before tax) Amount Yield [1] Amount Yield [1] Amount Yield [1]
Fixed maturities [2] $ 2,623 4.1 % $ 3,352 4.2% $ 3,382 4.2 %
Equity securities, AFS 30 3.6 % 37 4.3 % 36 3.8 %
Mortgage loans 262 4.9 % 337 5.2 % 281 5.4 %
Policy loans 83 5.9 % 119 6.0 % 131 6.1 %
Limited partnerships and other alternative investments 287 9.5 % 196 7.1 % 243 12.0 %
Other investments [3] 200 297 305
Investment expense (123) (111) (115)
Total securities AFS and other $ 3,362 4.3% $ 4,227 4.3% $ 4,263 4.4%
Equity securities, trading 6,061 4,364 (1,345)
Total net investment income (loss) $ 9,423 $ 8,591 $ 2,918
Total securities, AFS and other excluding limited partnerships
and other alternative investments 3,075 4.1% 4,031 4.3% 4,020 4.2%
[1] Yields calculated using annualized net investment income (excluding income related to equity securities, trading) divided by the monthly average
invested assets at cost, or adjusted carrying value, as applicable, excluding equity securities, trading, repurchase agreement and dollar roll
collateral, and consolidated variable interest entity non-controlling interests. Yield calculations for the year ended December 31, 2013 exclude
assets transferred due to the sale of the Retirement Plans and Individual Life businesses. Yield calculations for all periods exclude income and
assets associated with the disposal of the HLIL business. Yields by asset type exclude investment expenses.
[2] Includes net investment income on short-term investments.
[3] Primarily includes income from derivatives that qualify for hedge accounting and hedge fixed maturities.
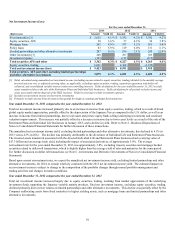
Year ended December 31, 2013 compared to the year ended December 31, 2012
Total net investment income increased primarily due to an increase in income from equity securities, trading, which is a result of broad
global equity market appreciation, partially offset by the depreciation of the Japanese Yen as compared to the U.S. dollar; as well as an
increase in income from limited partnerships, due to real estate and private equity funds selling underlying investments and continued
valuation improvements. This increase was partially offset by a decrease in income due to lower asset levels as a result of the sale of the
Retirement Plans and Individual Life businesses in January 2013, and a decline in yield. Refer to Note 2 - Business Dispositions of
Notes to Consolidated Financial Statements for further discussion of these transactions.
The annualized net investment income yield, excluding limited partnerships and other alternative investments, has declined to 4.1% in
2013 versus 4.3% in 2012. The decline was primarily attributable to the divestiture of Individual Life and Retirement Plans businesses.
The invested assets transferred associated with the divested Individual Life and Retirement Plans businesses had a carrying value of
$17.3 billion and an average book yield, including the impact of associated derivatives, of approximately 5.0%. The average
reinvestment rate for the year ended December 31, 2013 was approximately 3.8%, excluding treasury securities and mortgage backed
securities related to dollar roll transactions, which is slightly higher than the average yield of sales and maturities for the same period.
For further discussion on dollar roll transactions see Note 6 - Investments and Derivative Investments of Notes to Consolidated Financial
Statements.
Based upon current reinvestment rates, we expect the annualized net investment income yield, excluding limited partnerships and other
alternative investments, for 2014, to remain relatively consistent with the 2013 net investment income yield. The estimated impact on
net investment income is subject to change as the composition of the portfolio changes through normal portfolio management and
trading activities and changes in market conditions.
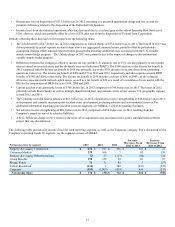
Year ended December 31, 2012 compared to the year ended December 31, 2011
Total net investment income increased largely due to equity securities, trading, resulting from market appreciation of the underlying
investment funds supporting the Japanese variable annuity products. Total net investment income, excluding equity securities, trading,
declined primarily due to lower returns on limited partnerships and other alternative investments. This decline was partially offset by the
Company reallocating assets from fixed maturities to higher yielding assets, such as mortgage loans and limited partnerships and other
alternative investments.