The Hartford 2013 Annual Report Download - page 38
Download and view the complete annual report
Please find page 38 of the 2013 The Hartford annual report below. You can navigate through the pages in the report by either clicking on the pages listed below, or by using the keyword search tool below to find specific information within the annual report.-
 1
1 -
2
-
3
-
4
-
5
-
6
-
7
-
8
-
9
-
10
-
11
-
12
-
13
-
14
-
15
-
16
-
17
-
18
-
19
-
20
-
21
-
22
-
23
-
24
-
25
-
26
-
27
-
 28
28 -
 29
29 -
 30
30 -
 31
31 -
 32
32 -
 33
33 -
 34
34 -
 35
35 -
 36
36 -
 37
37 -
 38
38 -
 39
39 -
 40
40 -
 41
41 -
 42
42 -
 43
43 -
 44
44 -
 45
45 -
 46
46 -
 47
47 -
 48
48 -
49
-
50
-
51
-
52
-
53
-
54
-
55
-
56
-
57
-
58
-
59
-
60
-
61
-
62
-
63
-
64
-
65
-
66
-
67
-
68
-
69
-
70
-
71
-
72
-
73
-
74
-
75
-
76
-
77
-
78
-
79
-
80
-
81
-
82
-
83
-
84
-
85
-
86
-
87
-
88
-
89
-
90
-
91
-
92
-
93
-
94
-
95
-
96
-
97
-
98
-
99
-
100
-
101
-
102
-
103
-
104
-
105
-
106
-
107
-
108
-
109
-
110
-
111
-
112
-
113
-
114
-
115
-
116
-
117
-
118
-
119
-
120
-
121
-
122
-
123
-
124
-
125
-
126
-
127
-
128
-
129
-
130
-
131
-
132
-
133
-
134
-
135
-
136
-
137
-
138
-
139
-
140
-
141
-
142
-
143
-
144
-
145
-
146
-
147
-
148
-
149
-
150
-
151
-
152
-
153
-
154
-
155
-
156
-
157
-
158
-
159
-
160
-
161
-
162
-
163
-
164
-
165
-
166
-
167
-
168
-
169
-
170
-
171
-
172
-
173
-
174
-
175
-
176
-
177
-
178
-
179
-
180
-
181
-
182
-
183
-
184
-
185
-
186
-
187
-
188
-
189
-
190
-
191
-
192
-
193
-
194
-
195
-
196
-
197
-
198
-
199
-
200
-
201
-
202
-
203
-
204
-
205
-
206
-
207
-
208
-
209
-
210
-
211
-
212
-
213
-
214
-
215
-
216
-
217
-
218
-
219
-
220
-
221
-
222
-
223
-
224
-
225
-
226
-
227
-
228
-
229
-
230
-
231
-
232
-
233
-
234
-
235
-
236
-
237
-
238
-
239
-
240
-
241
-
242
-
243
-
244
-
245
-
246
-
247
-
248
-
249
-
250
 |
 |
38
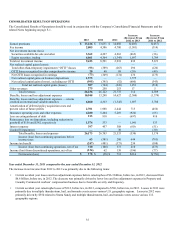
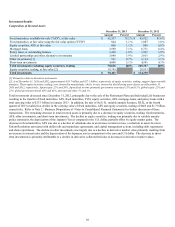
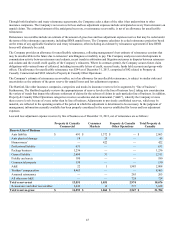
Investment Results
Composition of Invested Assets
December 31, 2013 December 31, 2012
Amount Percent Amount Percent
Fixed maturities, available-for-sale ("AFS"), at fair value $ 62,357 79.2 % $ 85,922 81.6 %
Fixed maturities, at fair value using the fair value option ("FVO") 844 1.1 % 1,087 1.0 %
Equity securities, AFS, at fair value 868 1.1 % 890 0.8 %
Mortgage loans 5,598 7.1 % 6,711 6.4 %
Policy loans, at outstanding balance 1,420 1.8 % 1,997 1.9 %
Limited partnerships and other alternative investments 3,040 3.9 % 3,015 2.9 %
Other investments [1] 521 0.7 % 1,114 1.1 %
Short-term investments 4,008 5.1 % 4,581 4.3 %
Total investments excluding equity securities, trading 78,656 100% 105,317 100%
Equity securities, trading, at fair value [2] 19,745 28,933
Total investments $ 98,401 $ 134,250
[1] Primarily relates to derivative instruments.
[2] As of December 31, 2013 and 2012, approximately $19.7 billion and $27.1 billion, respectively, of equity securities, trading, support Japan variable
annuities. Those equity securities, trading, were invested in mutual funds, which, in turn, invested in the following asset classes as of December 31,
2013 and 2012, respectively: Japan equity 22% and 20%, Japan fixed income (primarily government securities) 15% and 15%, global equity 22% and
21%, global government bonds 40% and 43%, and cash and other 1% and 1%.
Total investments decreased since December 31, 2012, principally due to the sale of the Retirement Plans and Individual Life businesses
resulting in the transfer of fixed maturities, AFS, fixed maturities, FVO, equity securities, AFS, mortgage loans, and policy loans with a
total carrying value of $17.3 billion in January 2013. In addition, the sale of the U.K. variable annuity business, HLIL, in the fourth
quarter of 2013 resulted in a decline in the carrying value of fixed maturities, AFS and equity securities, trading of $469 and $1.7 billion,
respectively. Refer to Note 2 - Business Dispositions of Notes to Consolidated Financial Statements for further discussion of these
transactions. The remaining decrease in total invested assets is primarily due to a decrease in equity securities, trading, fixed maturities,
AFS, other investments, and short-term investments. The decline in equity securities, trading was primarily due to variable annuity
policy surrenders, the depreciation of the Japanese Yen as compared to the U.S. dollar, partially offset by equity market gains. The
decrease in fixed maturities, AFS was due to a decline in valuations due to an increase in interest rates, a reduction in assets levels in
Talcott Resolution associated with dollar rolls and repurchase agreements, and capital management actions, including debt repayments
and share repurchases. The decline in other investments was largely due to a decline in derivative market value primarily resulting from
an increase in interest rates and the depreciation of the Japanese yen in comparison to the euro and U.S dollar. The decrease in short-
term investments is primarily attributable to a decline in derivative collateral held due to decreases in derivative market values.