The Hartford 2013 Annual Report Download - page 49
Download and view the complete annual report
Please find page 49 of the 2013 The Hartford annual report below. You can navigate through the pages in the report by either clicking on the pages listed below, or by using the keyword search tool below to find specific information within the annual report.-
 1
1 -
2
-
3
-
4
-
5
-
6
-
7
-
8
-
9
-
10
-
11
-
12
-
13
-
14
-
15
-
16
-
17
-
18
-
19
-
20
-
21
-
22
-
23
-
24
-
25
-
26
-
27
-
28
-
29
-
30
-
31
-
32
-
33
-
34
-
35
-
36
-
37
-
38
-
 39
39 -
 40
40 -
 41
41 -
 42
42 -
 43
43 -
 44
44 -
 45
45 -
 46
46 -
 47
47 -
 48
48 -
 49
49 -
 50
50 -
 51
51 -
 52
52 -
 53
53 -
 54
54 -
 55
55 -
 56
56 -
 57
57 -
 58
58 -
 59
59 -
60
-
61
-
62
-
63
-
64
-
65
-
66
-
67
-
68
-
69
-
70
-
71
-
72
-
73
-
74
-
75
-
76
-
77
-
78
-
79
-
80
-
81
-
82
-
83
-
84
-
85
-
86
-
87
-
88
-
89
-
90
-
91
-
92
-
93
-
94
-
95
-
96
-
97
-
98
-
99
-
100
-
101
-
102
-
103
-
104
-
105
-
106
-
107
-
108
-
109
-
110
-
111
-
112
-
113
-
114
-
115
-
116
-
117
-
118
-
119
-
120
-
121
-
122
-
123
-
124
-
125
-
126
-
127
-
128
-
129
-
130
-
131
-
132
-
133
-
134
-
135
-
136
-
137
-
138
-
139
-
140
-
141
-
142
-
143
-
144
-
145
-
146
-
147
-
148
-
149
-
150
-
151
-
152
-
153
-
154
-
155
-
156
-
157
-
158
-
159
-
160
-
161
-
162
-
163
-
164
-
165
-
166
-
167
-
168
-
169
-
170
-
171
-
172
-
173
-
174
-
175
-
176
-
177
-
178
-
179
-
180
-
181
-
182
-
183
-
184
-
185
-
186
-
187
-
188
-
189
-
190
-
191
-
192
-
193
-
194
-
195
-
196
-
197
-
198
-
199
-
200
-
201
-
202
-
203
-
204
-
205
-
206
-
207
-
208
-
209
-
210
-
211
-
212
-
213
-
214
-
215
-
216
-
217
-
218
-
219
-
220
-
221
-
222
-
223
-
224
-
225
-
226
-
227
-
228
-
229
-
230
-
231
-
232
-
233
-
234
-
235
-
236
-
237
-
238
-
239
-
240
-
241
-
242
-
243
-
244
-
245
-
246
-
247
-
248
-
249
-
250
 |
 |
49
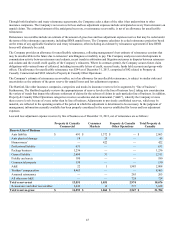
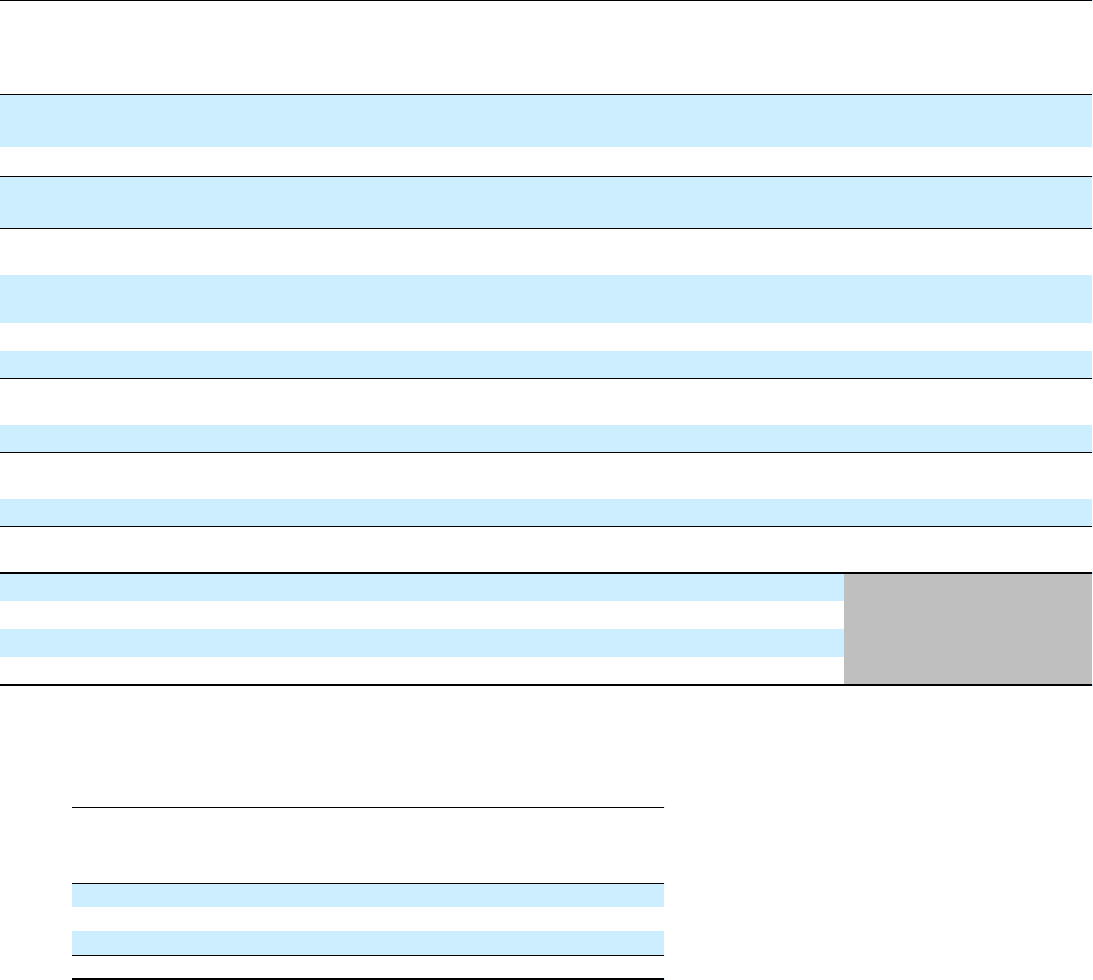
Reserve Roll-forwards and Development
Based on the results of the quarterly reserve review process, the Company determines the appropriate reserve adjustments, if any, to
record. Recorded reserve estimates are changed after consideration of numerous factors, including but not limited to, the magnitude of
the difference between the actuarial indication and the recorded reserves, improvement or deterioration of actuarial indications in the
period, the maturity of the accident year, trends observed over the recent past and the level of volatility within a particular line of
business. In general, adjustments are made more quickly to more mature accident years and less volatile lines of business. Such
adjustments of reserves are referred to as “reserve development”. Reserve development that increases previous estimates of ultimate cost
is called “reserve strengthening”. Reserve development that decreases previous estimates of ultimate cost is called “reserve releases”.
Reserve development can influence the comparability of year over year underwriting results and is set forth in the paragraphs and tables
that follow.
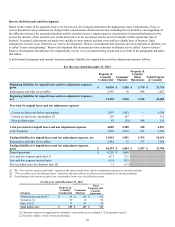
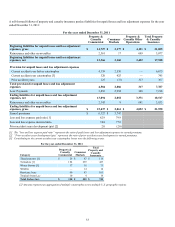
A roll-forward of property and casualty insurance product liabilities for unpaid losses and loss adjustment expenses follows:
For the year ended December 31, 2013
Property &
Casualty
Commercial Consumer
Markets
Property &
Casualty
Other
Operations Total Property
& Casualty
Beginning liabilities for unpaid losses and loss adjustment expenses,
gross $ 16,020 $ 1,926 $ 3,770 $ 21,716
Reinsurance and other recoverables 2,365 16 646 3,027
Beginning liabilities for unpaid losses and loss adjustment expenses,
net 13,655 1,910 3,124 18,689
Provision for unpaid losses and loss adjustment expenses
Current accident year before catastrophes 3,897 2,412 — 6,309
Current accident year catastrophes [3] 105 207 — 312
Prior accident years 83 (39) 148 192
Total provision for unpaid losses and loss adjustment expenses 4,085 2,580 148 6,813
Less: Payments 3,889 2,639 298 6,826
Ending liabilities for unpaid losses and loss adjustment expenses, net 13,851 1,851 2,974 18,676
Reinsurance and other recoverables 2,442 13 573 3,028
Ending liabilities for unpaid losses and loss adjustment expenses,
gross $ 16,293 $ 1,864 $ 3,547 $ 21,704
Earned premiums $ 6,203 $ 3,660
Loss and loss expense paid ratio [1] 62.7 72.1
Loss and loss expense incurred ratio 65.9 70.5
Prior accident years development (pts) [2] 1.3 (1.1)
[1] The “loss and loss expense paid ratio” represents the ratio of paid losses and loss adjustment expenses to earned premiums.
[2] “Prior accident years development (pts)” represents the ratio of prior accident years development to earned premiums.
[3] Contributing to the current accident year catastrophes losses were the following events:
For the year ended December 31, 2013
Category
Property &
Casualty
Commercial Consumer
Markets
Total
Property and
Casualty
Insurance
Thunderstorms and hail [1] $ 65 $ 103 $ 168
Tornadoes [1] 27 63 90
Other [1] [2] 13 41 54
Total (before tax) $ 105 $ 207 $ 312
[1] Amounts represent an aggregation of multiple catastrophes across multiple U.S. geographic regions.
[2] Includes wildfire, winter storms and flooding.