The Hartford 2013 Annual Report Download - page 117
Download and view the complete annual report
Please find page 117 of the 2013 The Hartford annual report below. You can navigate through the pages in the report by either clicking on the pages listed below, or by using the keyword search tool below to find specific information within the annual report.-
 1
1 -
2
-
3
-
4
-
5
-
6
-
7
-
8
-
9
-
10
-
11
-
12
-
13
-
14
-
15
-
16
-
17
-
18
-
19
-
20
-
21
-
22
-
23
-
24
-
25
-
26
-
27
-
28
-
29
-
30
-
31
-
32
-
33
-
34
-
35
-
36
-
37
-
38
-
39
-
40
-
41
-
42
-
43
-
44
-
45
-
46
-
47
-
48
-
49
-
50
-
51
-
52
-
53
-
54
-
55
-
56
-
57
-
58
-
59
-
60
-
61
-
62
-
63
-
64
-
65
-
66
-
67
-
68
-
69
-
70
-
71
-
72
-
73
-
74
-
75
-
76
-
77
-
78
-
79
-
80
-
81
-
82
-
83
-
84
-
85
-
86
-
87
-
88
-
89
-
90
-
91
-
92
-
93
-
94
-
95
-
96
-
97
-
98
-
99
-
100
-
101
-
102
-
103
-
104
-
105
-
106
-
 107
107 -
 108
108 -
 109
109 -
 110
110 -
 111
111 -
 112
112 -
 113
113 -
 114
114 -
 115
115 -
 116
116 -
 117
117 -
 118
118 -
 119
119 -
 120
120 -
 121
121 -
 122
122 -
 123
123 -
 124
124 -
 125
125 -
 126
126 -
 127
127 -
128
-
129
-
130
-
131
-
132
-
133
-
134
-
135
-
136
-
137
-
138
-
139
-
140
-
141
-
142
-
143
-
144
-
145
-
146
-
147
-
148
-
149
-
150
-
151
-
152
-
153
-
154
-
155
-
156
-
157
-
158
-
159
-
160
-
161
-
162
-
163
-
164
-
165
-
166
-
167
-
168
-
169
-
170
-
171
-
172
-
173
-
174
-
175
-
176
-
177
-
178
-
179
-
180
-
181
-
182
-
183
-
184
-
185
-
186
-
187
-
188
-
189
-
190
-
191
-
192
-
193
-
194
-
195
-
196
-
197
-
198
-
199
-
200
-
201
-
202
-
203
-
204
-
205
-
206
-
207
-
208
-
209
-
210
-
211
-
212
-
213
-
214
-
215
-
216
-
217
-
218
-
219
-
220
-
221
-
222
-
223
-
224
-
225
-
226
-
227
-
228
-
229
-
230
-
231
-
232
-
233
-
234
-
235
-
236
-
237
-
238
-
239
-
240
-
241
-
242
-
243
-
244
-
245
-
246
-
247
-
248
-
249
-
250
 |
 |

117
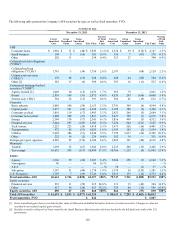
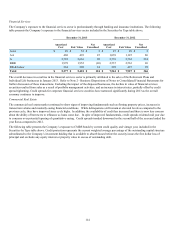
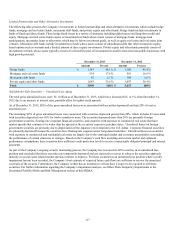
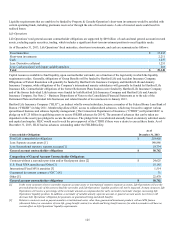
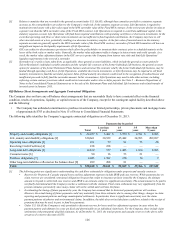
Limited Partnerships and Other Alternative Investments
The following table presents the Company’s investments in limited partnerships and other alternative investments which include hedge
funds, mortgage and real estate funds, mezzanine debt funds, and private equity and other funds. Hedge funds include investments in
funds of funds and direct funds. These hedge funds invest in a variety of strategies including global macro and long/short credit and
equity. Mortgage and real estate funds consist of investments in funds whose assets consist of mortgage loans, mortgage loan
participations, mezzanine loans or other notes which may be below investment grade, as well as equity real estate and real estate joint
ventures. Mezzanine debt funds include investments in funds whose assets consist of subordinated debt that often incorporate equity-
based options such as warrants and a limited amount of direct equity investments. Private equity and other funds primarily consist of
investments in funds whose assets typically consist of a diversified pool of investments in small to mid-sized non-public businesses with
high growth potential.
December 31, 2013 December 31, 2012
Amount Percent Amount Percent
Hedge funds $ 1,341 44.1% $ 1,309 43.4 %
Mortgage and real estate funds 534 17.6% 501 16.6 %
Mezzanine debt funds 82 2.7% 108 3.6 %
Private equity and other funds 1,083 35.6 % 1,097 36.4%
Total $ 3,040 100% $ 3,015 100%
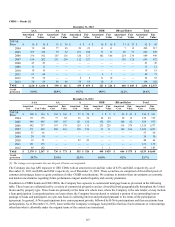
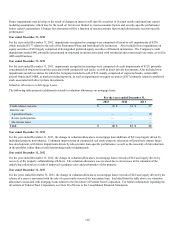
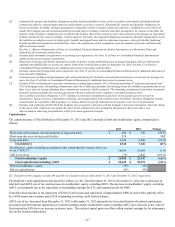
Available-for-Sale Securities — Unrealized Loss Aging
The total gross unrealized losses were $1.1 billion as of December 31, 2013, which have increased $15, or 1%, from December 31,
2012 due to an increase in interest rates, partially offset by tighter credit spreads.
As of December 31, 2013, $826 of the gross unrealized losses were associated with securities depressed less than 20% of cost or
amortized cost.
The remaining $251 of gross unrealized losses were associated with securities depressed greater than 20%, which includes $2 associated
with securities depressed over 50% for twelve months or more. The securities depressed more than 20% are primarily foreign
government securities, floating rate corporate financial securities, and securities with exposure to commercial real estate that have
market spreads that continue to be wider than the spreads at the securities' respective purchase dates. Unrealized losses on foreign
government securities are primarily due to depreciation of the Japanese yen in relation to the U.S. dollar. Corporate financial securities
are primarily depressed because the securities have floating-rate coupons and/or long-dated maturities. Unrealized losses on securities
with exposure to commercial and residential real estate are largely due to the continued market and economic uncertainties surrounding
the performance of certain structures or vintages. Based on the Company’s cash flow modeling and current market and collateral
performance assumptions, these securities have sufficient credit protection levels to receive contractually obligated principal and interest
payments.
As part of the Company’s ongoing security monitoring process, the Company has reviewed its AFS securities in an unrealized loss
position and concluded that these securities are temporarily depressed and are expected to recover in value as the securities approach
maturity or as real estate related market spreads continue to improve. For these securities in an unrealized loss position where a credit
impairment has not been recorded, the Company’s best estimate of expected future cash flows are sufficient to recover the amortized
cost basis of the security. Furthermore, the Company neither has an intention to sell nor does it expect to be required to sell these
securities. For further information regarding the Company’s impairment analysis, see Other-Than-Temporary Impairments in the
Investment Portfolio Risks and Risk Management section of this MD&A.