The Hartford 2013 Annual Report Download - page 146
Download and view the complete annual report
Please find page 146 of the 2013 The Hartford annual report below. You can navigate through the pages in the report by either clicking on the pages listed below, or by using the keyword search tool below to find specific information within the annual report.-
 1
1 -
2
-
3
-
4
-
5
-
6
-
7
-
8
-
9
-
10
-
11
-
12
-
13
-
14
-
15
-
16
-
17
-
18
-
19
-
20
-
21
-
22
-
23
-
24
-
25
-
26
-
27
-
28
-
29
-
30
-
31
-
32
-
33
-
34
-
35
-
36
-
37
-
38
-
39
-
40
-
41
-
42
-
43
-
44
-
45
-
46
-
47
-
48
-
49
-
50
-
51
-
52
-
53
-
54
-
55
-
56
-
57
-
58
-
59
-
60
-
61
-
62
-
63
-
64
-
65
-
66
-
67
-
68
-
69
-
70
-
71
-
72
-
73
-
74
-
75
-
76
-
77
-
78
-
79
-
80
-
81
-
82
-
83
-
84
-
85
-
86
-
87
-
88
-
89
-
90
-
91
-
92
-
93
-
94
-
95
-
96
-
97
-
98
-
99
-
100
-
101
-
102
-
103
-
104
-
105
-
106
-
107
-
108
-
109
-
110
-
111
-
112
-
113
-
114
-
115
-
116
-
117
-
118
-
119
-
120
-
121
-
122
-
123
-
124
-
125
-
126
-
127
-
128
-
129
-
130
-
131
-
132
-
133
-
134
-
135
-
 136
136 -
 137
137 -
 138
138 -
 139
139 -
 140
140 -
 141
141 -
 142
142 -
 143
143 -
 144
144 -
 145
145 -
 146
146 -
 147
147 -
 148
148 -
 149
149 -
 150
150 -
 151
151 -
 152
152 -
 153
153 -
 154
154 -
 155
155 -
 156
156 -
157
-
158
-
159
-
160
-
161
-
162
-
163
-
164
-
165
-
166
-
167
-
168
-
169
-
170
-
171
-
172
-
173
-
174
-
175
-
176
-
177
-
178
-
179
-
180
-
181
-
182
-
183
-
184
-
185
-
186
-
187
-
188
-
189
-
190
-
191
-
192
-
193
-
194
-
195
-
196
-
197
-
198
-
199
-
200
-
201
-
202
-
203
-
204
-
205
-
206
-
207
-
208
-
209
-
210
-
211
-
212
-
213
-
214
-
215
-
216
-
217
-
218
-
219
-
220
-
221
-
222
-
223
-
224
-
225
-
226
-
227
-
228
-
229
-
230
-
231
-
232
-
233
-
234
-
235
-
236
-
237
-
238
-
239
-
240
-
241
-
242
-
243
-
244
-
245
-
246
-
247
-
248
-
249
-
250
 |
 |
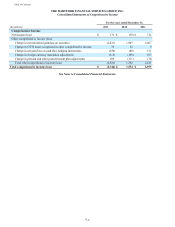
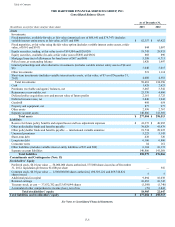
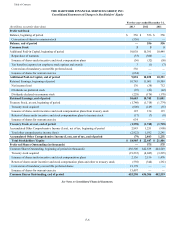
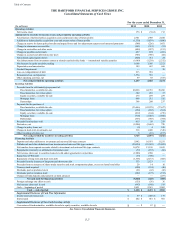
THE HARTFORD FINANCIAL SERVICES GROUP, INC.
NOTES TO CONSOLIDATED FINANCIAL STATEMENTS (continued)
1. Basis of Presentation and Significant Accounting Policies (continued)
F-10
Dividends to Policyholders
Policyholder dividends are paid to certain property and casualty and life insurance policyholders. Policies that receive dividends are
referred to as participating policies. Such dividends are accrued using an estimate of the amount to be paid based on underlying
contractual obligations under policies and applicable state laws.
Net written premiums for participating property and casualty insurance policies represented 10%, 10% and 9% of total net written
premiums for the years ended December 31, 2013, 2012 and 2011, respectively. Participating dividends to policyholders were $16, $14
and $18 for the years ended December 31, 2013, 2012 and 2011, respectively.
Total participating policies in-force represented 1% of the total life insurance policies in-force as of December 31, 2013, 2012 and 2011.
Dividends to policyholders were $18, $20 and $17 for the years ended December 31, 2013, 2012 and 2011, respectively. There were no
additional amounts of income allocated to participating policyholders. If limitations exist on the amount of net income from participating
life insurance contracts that may be distributed to stockholder’s, the policyholder’s share of net income on those contracts that cannot be
distributed is excluded from stockholder’s equity by a charge to operations and a credit to a liability.
Fair Value
The following financial instruments are carried at fair value in the Company’s Consolidated Financial Statements: fixed maturity and
equity securities, available-for-sale (“AFS”); fixed maturities at fair value using fair value option (“FVO”); equity securities, trading;
short-term investments; freestanding and embedded derivatives; certain limited partnerships and other alternative investments; separate
account assets and certain other liabilities. For further discussion of fair value, see Note 5 - Fair Value Measurements of Notes to
Consolidated Financial Statements.
Investments
Overview
The Company’s investments in fixed maturities include bonds, structured securities, redeemable preferred stock and commercial paper.
These investments, along with certain equity securities, which include common and non-redeemable preferred stocks, are classified as
AFS and are carried at fair value. The after-tax difference from cost or amortized cost is reflected in stockholders’ equity as a component
of Accumulated Other Comprehensive Income (Loss) (“AOCI”), after adjustments for the effect of deducting the life and pension
policyholders’ share of the immediate participation guaranteed contracts and certain life and annuity deferred policy acquisition costs
and reserve adjustments. Fixed maturities for which the Company elected the fair value option are classified as FVO and are carried at
fair value with changes in value recorded in realized capital gains and losses on the Company's Consolidated Statements of Operations.
The equity investments associated with the variable annuity products offered in Japan are recorded at fair value and are classified as
trading with changes in fair value recorded in net investment income. Policy loans are carried at outstanding balance. Mortgage loans are
recorded at the outstanding principal balance adjusted for amortization of premiums or discounts and net of valuation allowances. Short-
term investments are carried at amortized cost, which approximates fair value. Limited partnerships and other alternative investments are
reported at their carrying value with the change in carrying value primarily accounted for under the equity method and accordingly the
Company’s share of earnings are included in net investment income. In addition, for investments in a wholly-owned fund of funds, the
Company recognizes changes in the fair value of the underlying funds in net investment income, which is consistent with accounting
requirements for investment companies. Recognition of income related to limited partnerships and other alternative investments is
delayed due to the availability of the related financial information, as private equity and other funds are generally on a three-month delay
and hedge funds are on a one-month delay. Accordingly, income for the years ended December 31, 2013, 2012, and 2011 may not
include the full impact of current year changes in valuation of the underlying assets and liabilities of the funds, which are generally
obtained from the limited partnerships and other alternative investments’ general partners. Other investments primarily consist of
derivatives instruments which are carried at fair value.