The Hartford 2013 Annual Report Download - page 100
Download and view the complete annual report
Please find page 100 of the 2013 The Hartford annual report below. You can navigate through the pages in the report by either clicking on the pages listed below, or by using the keyword search tool below to find specific information within the annual report.-
 1
1 -
2
-
3
-
4
-
5
-
6
-
7
-
8
-
9
-
10
-
11
-
12
-
13
-
14
-
15
-
16
-
17
-
18
-
19
-
20
-
21
-
22
-
23
-
24
-
25
-
26
-
27
-
28
-
29
-
30
-
31
-
32
-
33
-
34
-
35
-
36
-
37
-
38
-
39
-
40
-
41
-
42
-
43
-
44
-
45
-
46
-
47
-
48
-
49
-
50
-
51
-
52
-
53
-
54
-
55
-
56
-
57
-
58
-
59
-
60
-
61
-
62
-
63
-
64
-
65
-
66
-
67
-
68
-
69
-
70
-
71
-
72
-
73
-
74
-
75
-
76
-
77
-
78
-
79
-
80
-
81
-
82
-
83
-
84
-
85
-
86
-
87
-
88
-
89
-
 90
90 -
 91
91 -
 92
92 -
 93
93 -
 94
94 -
 95
95 -
 96
96 -
 97
97 -
 98
98 -
 99
99 -
 100
100 -
 101
101 -
 102
102 -
 103
103 -
 104
104 -
 105
105 -
 106
106 -
 107
107 -
 108
108 -
 109
109 -
 110
110 -
111
-
112
-
113
-
114
-
115
-
116
-
117
-
118
-
119
-
120
-
121
-
122
-
123
-
124
-
125
-
126
-
127
-
128
-
129
-
130
-
131
-
132
-
133
-
134
-
135
-
136
-
137
-
138
-
139
-
140
-
141
-
142
-
143
-
144
-
145
-
146
-
147
-
148
-
149
-
150
-
151
-
152
-
153
-
154
-
155
-
156
-
157
-
158
-
159
-
160
-
161
-
162
-
163
-
164
-
165
-
166
-
167
-
168
-
169
-
170
-
171
-
172
-
173
-
174
-
175
-
176
-
177
-
178
-
179
-
180
-
181
-
182
-
183
-
184
-
185
-
186
-
187
-
188
-
189
-
190
-
191
-
192
-
193
-
194
-
195
-
196
-
197
-
198
-
199
-
200
-
201
-
202
-
203
-
204
-
205
-
206
-
207
-
208
-
209
-
210
-
211
-
212
-
213
-
214
-
215
-
216
-
217
-
218
-
219
-
220
-
221
-
222
-
223
-
224
-
225
-
226
-
227
-
228
-
229
-
230
-
231
-
232
-
233
-
234
-
235
-
236
-
237
-
238
-
239
-
240
-
241
-
242
-
243
-
244
-
245
-
246
-
247
-
248
-
249
-
250
 |
 |
100
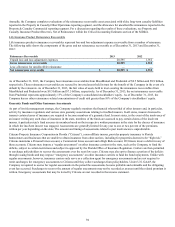
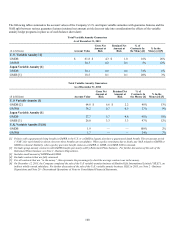
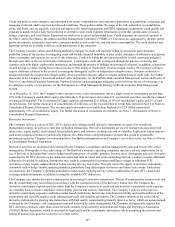
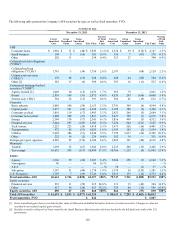
The following tables summarize the account values of the Company’s U.S. and Japan variable annuities with guarantee features and the
NAR split between various guarantee features (retained net amount at risk does not take into consideration the effects of the variable
annuity hedge programs in place as of each balance sheet date):
Total Variable Annuity Guarantees
As of December 31, 2013
($ in billions) Account Value
Gross Net
Amount at
Risk
Retained Net
Amount at
Risk
% of
Contracts In
the Money[4] % In the
Money [4] [5]
U. S. Variable Annuity [1]
GMDB $ 61.8 $ 4.3 $ 1.0 16% 26%
GMWB 30.3 0.2 0.1 5% 12%
Japan Variable Annuity [1]
GMDB 20.1 0.8 0.6 31% 8%
GMIB [3] 18.5 0.1 0.1 20% 3%
Total Variable Annuity Guarantees
As of December 31, 2012
($ in billions) Account Value
Gross Net
Amount at
Risk
Retained Net
Amount at
Risk
% of
Contracts In
the Money [4] % In the
Money [4] [5]
U. S Variable Annuity [1]
GMDB [2] 64.8 $ 6.6 $ 2.2 48% 13%
GMWB 34.2 0.7 0.5 23% 9%
Japan Variable Annuity [1]
GMDB 27.7 5.7 4.8 98% 18%
GMIB [3] 26.0 3.3 3.3 97% 12%
U.K. Variable Annuity [1] [6]
GMDB 1.9 — — 100% 2%
GMWB 1.7 — — 24% 7%
[1] Policies with a guaranteed living benefit (a GMWB in the U.S. or a GMIB in Japan) also have a guaranteed death benefit. The net amount at risk
(“NAR”) for each benefit is shown; however these benefits are not additive. When a policy terminates due to death, any NAR related to GMWB or
GMIB is released. Similarly, when a policy goes into benefit status on a GMWB or GMIB, its GMDB NAR is released.
[2] Excludes group annuity contracts with GMDB benefits previously sold by Retirement Plans business. For further discussion of the sale of the
Retirement Plans business, see Note 2 - Business Dispositions.
[3] Includes small amount of GMWB and GMAB.
[4] Excludes contracts that are fully reinsured.
[5] For all contracts that are “in the money”, this represents the percentage by which the average contract was in the money.
[6] On December 12, 2013, the Company completed the sale of the U.K variable annuity business of Hartford Life International Limited ("HLIL"), an
indirect wholly-owned subsidiary. For further discussion of the sale of the U.K. variable annuity business, HLIL in 2013, see Note 2 - Business
Dispositions and Note 20 - Discontinued Operations of Notes to Consolidated Financial Statements.