The Hartford 2013 Annual Report Download - page 51
Download and view the complete annual report
Please find page 51 of the 2013 The Hartford annual report below. You can navigate through the pages in the report by either clicking on the pages listed below, or by using the keyword search tool below to find specific information within the annual report.-
 1
1 -
2
-
3
-
4
-
5
-
6
-
7
-
8
-
9
-
10
-
11
-
12
-
13
-
14
-
15
-
16
-
17
-
18
-
19
-
20
-
21
-
22
-
23
-
24
-
25
-
26
-
27
-
28
-
29
-
30
-
31
-
32
-
33
-
34
-
35
-
36
-
37
-
38
-
39
-
40
-
 41
41 -
 42
42 -
 43
43 -
 44
44 -
 45
45 -
 46
46 -
 47
47 -
 48
48 -
 49
49 -
 50
50 -
 51
51 -
 52
52 -
 53
53 -
 54
54 -
 55
55 -
 56
56 -
 57
57 -
 58
58 -
 59
59 -
 60
60 -
 61
61 -
62
-
63
-
64
-
65
-
66
-
67
-
68
-
69
-
70
-
71
-
72
-
73
-
74
-
75
-
76
-
77
-
78
-
79
-
80
-
81
-
82
-
83
-
84
-
85
-
86
-
87
-
88
-
89
-
90
-
91
-
92
-
93
-
94
-
95
-
96
-
97
-
98
-
99
-
100
-
101
-
102
-
103
-
104
-
105
-
106
-
107
-
108
-
109
-
110
-
111
-
112
-
113
-
114
-
115
-
116
-
117
-
118
-
119
-
120
-
121
-
122
-
123
-
124
-
125
-
126
-
127
-
128
-
129
-
130
-
131
-
132
-
133
-
134
-
135
-
136
-
137
-
138
-
139
-
140
-
141
-
142
-
143
-
144
-
145
-
146
-
147
-
148
-
149
-
150
-
151
-
152
-
153
-
154
-
155
-
156
-
157
-
158
-
159
-
160
-
161
-
162
-
163
-
164
-
165
-
166
-
167
-
168
-
169
-
170
-
171
-
172
-
173
-
174
-
175
-
176
-
177
-
178
-
179
-
180
-
181
-
182
-
183
-
184
-
185
-
186
-
187
-
188
-
189
-
190
-
191
-
192
-
193
-
194
-
195
-
196
-
197
-
198
-
199
-
200
-
201
-
202
-
203
-
204
-
205
-
206
-
207
-
208
-
209
-
210
-
211
-
212
-
213
-
214
-
215
-
216
-
217
-
218
-
219
-
220
-
221
-
222
-
223
-
224
-
225
-
226
-
227
-
228
-
229
-
230
-
231
-
232
-
233
-
234
-
235
-
236
-
237
-
238
-
239
-
240
-
241
-
242
-
243
-
244
-
245
-
246
-
247
-
248
-
249
-
250
 |
 |

51
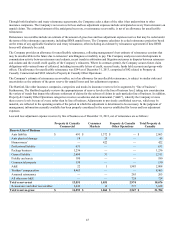
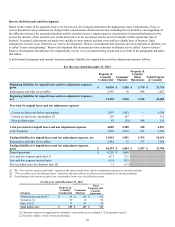
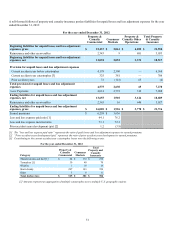
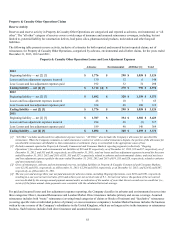
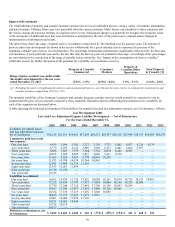
A roll-forward follows of property and casualty insurance product liabilities for unpaid losses and loss adjustment expenses for the year
ended December 31, 2012:
For the year ended December 31, 2012
Property &
Casualty
Commercial Consumer
Markets
Property &
Casualty Other
Operations
Total Property
& Casualty
Insurance
Beginning liabilities for unpaid losses and loss adjustment
expenses, gross $ 15,437 $ 2,061 $ 4,052 $ 21,550
Reinsurance and other recoverables 2,343 9 681 3,033
Beginning liabilities for unpaid losses and loss adjustment
expenses, net 13,094 2,052 3,371 18,517
Provision for unpaid losses and loss adjustment expenses
Current accident year before catastrophes 4,178 2,390 — 6,568
Current accident year catastrophes [3] 325 381 — 706
Prior accident years 72 (141) 65 (4)
Total provision for unpaid losses and loss adjustment
expenses 4,575 2,630 65 7,270
Less: Payments 4,014 2,772 312 7,098
Ending liabilities for unpaid losses and loss adjustment
expenses, net 13,655 1,910 3,124 18,689
Reinsurance and other recoverables 2,365 16 646 3,027
Ending liabilities for unpaid losses and loss adjustment
expenses, gross $ 16,020 $ 1,926 $ 3,770 $ 21,716
Earned premiums $ 6,259 $ 3,636
Loss and loss expense paid ratio [1] 64.1 76.2
Loss and loss expense incurred ratio 73.1 72.3
Prior accident years development (pts) [2] 1.2 (3.9)
[1] The “loss and loss expense paid ratio” represents the ratio of paid losses and loss adjustment expenses to earned premiums.
[2] “Prior accident years development (pts)” represents the ratio of prior accident years development to earned premiums.
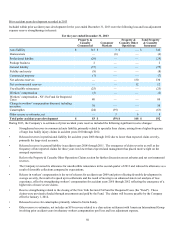
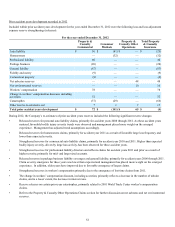
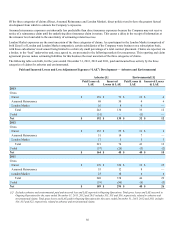
[3] Contributing to the current accident year catastrophes losses were the following events:
For the year ended December 31, 2012
Category
Property &
Casualty
Commercial Consumer
Markets
Total
Property and
Casualty
Insurance
Thunderstorms and hail [1] $ 84 $ 172 $ 256
Tornadoes [1] 30 40 70
Wildfire 1 18 19
Storm Sandy 207 143 350
Other 3 8 11
Total (before tax) $ 325 $ 381 $ 706
[1] Amounts represent an aggregation of multiple catastrophes across multiple U.S. geographic regions.