The Hartford 2013 Annual Report Download - page 238
Download and view the complete annual report
Please find page 238 of the 2013 The Hartford annual report below. You can navigate through the pages in the report by either clicking on the pages listed below, or by using the keyword search tool below to find specific information within the annual report.-
 1
1 -
2
-
3
-
4
-
5
-
6
-
7
-
8
-
9
-
10
-
11
-
12
-
13
-
14
-
15
-
16
-
17
-
18
-
19
-
20
-
21
-
22
-
23
-
24
-
25
-
26
-
27
-
28
-
29
-
30
-
31
-
32
-
33
-
34
-
35
-
36
-
37
-
38
-
39
-
40
-
41
-
42
-
43
-
44
-
45
-
46
-
47
-
48
-
49
-
50
-
51
-
52
-
53
-
54
-
55
-
56
-
57
-
58
-
59
-
60
-
61
-
62
-
63
-
64
-
65
-
66
-
67
-
68
-
69
-
70
-
71
-
72
-
73
-
74
-
75
-
76
-
77
-
78
-
79
-
80
-
81
-
82
-
83
-
84
-
85
-
86
-
87
-
88
-
89
-
90
-
91
-
92
-
93
-
94
-
95
-
96
-
97
-
98
-
99
-
100
-
101
-
102
-
103
-
104
-
105
-
106
-
107
-
108
-
109
-
110
-
111
-
112
-
113
-
114
-
115
-
116
-
117
-
118
-
119
-
120
-
121
-
122
-
123
-
124
-
125
-
126
-
127
-
128
-
129
-
130
-
131
-
132
-
133
-
134
-
135
-
136
-
137
-
138
-
139
-
140
-
141
-
142
-
143
-
144
-
145
-
146
-
147
-
148
-
149
-
150
-
151
-
152
-
153
-
154
-
155
-
156
-
157
-
158
-
159
-
160
-
161
-
162
-
163
-
164
-
165
-
166
-
167
-
168
-
169
-
170
-
171
-
172
-
173
-
174
-
175
-
176
-
177
-
178
-
179
-
180
-
181
-
182
-
183
-
184
-
185
-
186
-
187
-
188
-
189
-
190
-
191
-
192
-
193
-
194
-
195
-
196
-
197
-
198
-
199
-
200
-
201
-
202
-
203
-
204
-
205
-
206
-
207
-
208
-
209
-
210
-
211
-
212
-
213
-
214
-
215
-
216
-
217
-
218
-
219
-
220
-
221
-
222
-
223
-
224
-
225
-
226
-
227
-
 228
228 -
 229
229 -
 230
230 -
 231
231 -
 232
232 -
 233
233 -
 234
234 -
 235
235 -
 236
236 -
 237
237 -
 238
238 -
 239
239 -
 240
240 -
 241
241 -
 242
242 -
 243
243 -
 244
244 -
 245
245 -
 246
246 -
 247
247 -
 248
248 -
249
-
250
 |
 |
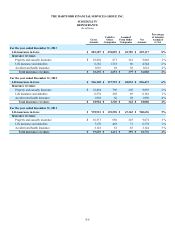
THE HARTFORD FINANCIAL SERVICES GROUP, INC.
NOTES TO CONSOLIDATED FINANCIAL STATEMENTS (continued)
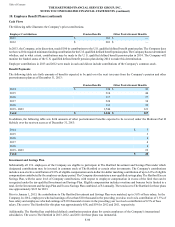
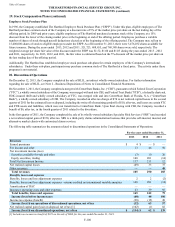
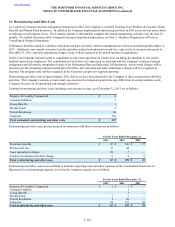
21. Restructuring and Other Costs (continued)
F-102
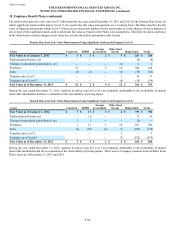
Changes in the accrued restructuring and other costs liability balance included in other liabilities in the Consolidated Balance Sheets are
as follows:
For the year ended December 31, 2013
Severance
Benefits and
Related Costs Professional
Fees Asset impairment
charges
Contract
Termination and
Other Charges Total Restructuring
and Other Costs
Balance, beginning of period $ 70 $ — $ — $ — $ 70
Accruals/provisions 22 19 20 6 67
Payments/write-offs (70) (19) (20) — (109)
Balance, end of period $ 22 $ — $ — $ 6 $ 28
For the year ended December 31, 2012
Severance
Benefits and
Related Costs Professional
Fees Asset impairment
charges
Contract
Termination and
Other Charges Total Restructuring
and Other Costs
Balance, beginning of period $ 12 $ — $ — $ 5 $ 17
Accruals/provisions 148 44 5 2 199
Payments/write-offs (90) (44) (5) (7) (146)
Balance, end of period $ 70 $ — $ — $ — $ 70
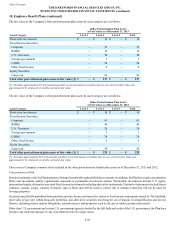
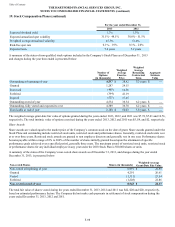
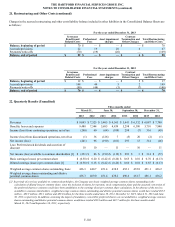
22. Quarterly Results (Unaudited)
Three months ended
March 31, June 30, September 30, December 31,
2013 2012 2013 2012 2013 2012 2013 2012
Revenues $ 9,043 $ 7,525 $ 5,465 $ 4,565 $ 5,641 $ 6,332 $ 6,087 $ 7,700
Benefits, losses and expenses 9,480 7,544 5,685 4,839 5,298 6,380 5,710 7,940
Income (loss) from continuing operations, net of tax (240) 60 (64)(108) 298 (7) 316 (45)
Income (loss) from discontinued operations, net of tax (1) 36 (126) 7 (5) 20 (2) (1)
Net income (loss) (241) 96 (190)(101) 293 13 314 (46)
Less: Preferred stock dividends and accretion of
discount 1010—11—10—11
Net income (loss) available to common shareholders [1] $ (251) $ 86 $ (190) $ (112) $ 293 $ 3 $ 314 $ (57)
Basic earnings (losses) per common share $ (0.58) $ 0.20 $ (0.42) $ (0.26) $ 0.65 $ 0.01 $ 0.70 $ (0.13)
Diluted earnings (losses) per common share [1] $ (0.58) $ 0.18 $ (0.42) $ (0.26) $ 0.60 $ 0.01 $ 0.65 $ (0.13)
Weighted average common shares outstanding, basic 436.3 440.7 451.4 438.2 452.1 435.8 451.1 436.2
Weighted average shares outstanding and dilutive
potential common shares 436.3 469.0 451.4 438.2 490.6 461.7 486.1 436.2
[1] In periods of a net loss available to common shareholders, the Company uses basic weighted average common shares outstanding in the
calculation of diluted loss per common share, since the inclusion of shares for warrants, stock compensation plans and the assumed conversion of
the preferred shares to common would have been antidilutive to the earnings (loss) per common share calculation. In the absence of the net loss
available to common shareholders, weighted average common shares outstanding and dilutive potential common shares would have totaled 485.8
million , 488.9 million, 493.1 million and 489.0 million for the three months ended June 30, 2012, December 31, 2012, March 31, 2013 and June
30, 2013, respectively. In addition, assuming the impact of mandatory convertible preferred shares was not antidilutive, weighted average common
shares outstanding and dilutive potential common shares would have totaled 489.9 million and 482.7 million for the three months ended
March 31, 2012 and September 30, 2012, respectively.