The Hartford 2013 Annual Report Download - page 119
Download and view the complete annual report
Please find page 119 of the 2013 The Hartford annual report below. You can navigate through the pages in the report by either clicking on the pages listed below, or by using the keyword search tool below to find specific information within the annual report.-
 1
1 -
2
-
3
-
4
-
5
-
6
-
7
-
8
-
9
-
10
-
11
-
12
-
13
-
14
-
15
-
16
-
17
-
18
-
19
-
20
-
21
-
22
-
23
-
24
-
25
-
26
-
27
-
28
-
29
-
30
-
31
-
32
-
33
-
34
-
35
-
36
-
37
-
38
-
39
-
40
-
41
-
42
-
43
-
44
-
45
-
46
-
47
-
48
-
49
-
50
-
51
-
52
-
53
-
54
-
55
-
56
-
57
-
58
-
59
-
60
-
61
-
62
-
63
-
64
-
65
-
66
-
67
-
68
-
69
-
70
-
71
-
72
-
73
-
74
-
75
-
76
-
77
-
78
-
79
-
80
-
81
-
82
-
83
-
84
-
85
-
86
-
87
-
88
-
89
-
90
-
91
-
92
-
93
-
94
-
95
-
96
-
97
-
98
-
99
-
100
-
101
-
102
-
103
-
104
-
105
-
106
-
107
-
108
-
 109
109 -
 110
110 -
 111
111 -
 112
112 -
 113
113 -
 114
114 -
 115
115 -
 116
116 -
 117
117 -
 118
118 -
 119
119 -
 120
120 -
 121
121 -
 122
122 -
 123
123 -
 124
124 -
 125
125 -
 126
126 -
 127
127 -
 128
128 -
 129
129 -
130
-
131
-
132
-
133
-
134
-
135
-
136
-
137
-
138
-
139
-
140
-
141
-
142
-
143
-
144
-
145
-
146
-
147
-
148
-
149
-
150
-
151
-
152
-
153
-
154
-
155
-
156
-
157
-
158
-
159
-
160
-
161
-
162
-
163
-
164
-
165
-
166
-
167
-
168
-
169
-
170
-
171
-
172
-
173
-
174
-
175
-
176
-
177
-
178
-
179
-
180
-
181
-
182
-
183
-
184
-
185
-
186
-
187
-
188
-
189
-
190
-
191
-
192
-
193
-
194
-
195
-
196
-
197
-
198
-
199
-
200
-
201
-
202
-
203
-
204
-
205
-
206
-
207
-
208
-
209
-
210
-
211
-
212
-
213
-
214
-
215
-
216
-
217
-
218
-
219
-
220
-
221
-
222
-
223
-
224
-
225
-
226
-
227
-
228
-
229
-
230
-
231
-
232
-
233
-
234
-
235
-
236
-
237
-
238
-
239
-
240
-
241
-
242
-
243
-
244
-
245
-
246
-
247
-
248
-
249
-
250
 |
 |

119
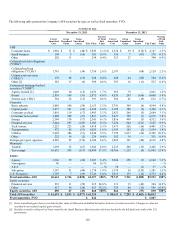
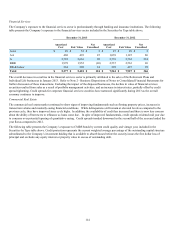
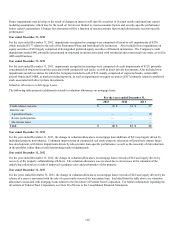
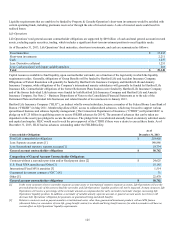
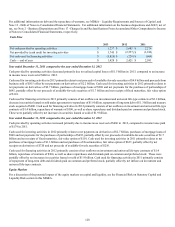
Other-Than-Temporary Impairments
The following table presents the Company’s impairments recognized in earnings by security type excluding intent-to-sell impairment
relating to the sales of Retirement Plans and Individual Life businesses.
For the years ended December 31,
2013 2012 [1] 2011
ABS $ 9 $ 29 $ 27
CRE CDOs 2 10 41
CMBS
Bonds 17 24 16
IOs 4 3 5
Corporate 20 28 50
Equity 15 65 17
RMBS Non-agency — — —
RMBS Alt-A — 1 1
RMBS sub-prime 6 12 15
Other — — 2
Total $ 73 $ 172 $ 174
[1] Excludes $177 of intent-to-sell impairments related to the sales of the Retirement Plans and Individual Life businesses.
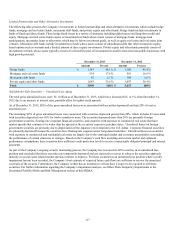
Year ended December 31, 2013
For the year ended December 31, 2013, impairments recognized in earnings were comprised of credit impairments of $32, securities that
the Company intends to sell of $26 and impairments on equity securities of $15.
Credit impairments were primarily concentrated in corporate and fixed-rate CMBS bonds. The corporate bonds were impaired due to
two issuers that have experienced financial difficulty and either defaulted or are expected to default on contractually obligated principal
and interest payments. The structured securities were impaired primarily due to actual performance or property-specific deterioration of
the underlying collateral. The Company calculated these impairments utilizing both a top down modeling approach and a security-
specific collateral review. The top down modeling approach used discounted cash flow models that considered losses under current and
expected future economic conditions. Assumptions used over the period included current macroeconomic factors, such as the
unemployment rate, as well as sector specific factors such as property values, delinquency levels, servicer behavior, and severity rates.
The macroeconomic assumptions considered by the Company did not materially change during 2013 and, as such, the credit
impairments recognized for the year ended December 31, 2013 were primarily driven by actual or expected collateral deterioration,
largely as a result of the Company’s security-specific collateral review.
The security-specific collateral review is performed to estimate potential future losses. This review incorporates assumptions about
expected future collateral cash flows, including projected default rates and severities. The results of the security-specific collateral
review allowed the Company to estimate the expected timing of a security’s first loss, if any, and the probability and severity of potential
ultimate losses. The Company then discounted these anticipated future cash flows at the security’s book yield prior to impairment.
Intent-to-sell impairments were primarily related to structured securities with exposure to commercial and residential real estate and
corporate securities, as a result of the Company's desire to reduce exposure to certain higher risk securities that are currently trading at
relatively attractive valuations. Impairments on equity securities were comprised of securities that have been in an unrealized loss
position and the Company no longer believes the securities will recover within the foreseeable future.
In addition to the credit impairments recognized in earnings, the Company recognized non-credit impairments in other comprehensive
income of $20 for the year ended December 31, 2013, predominantly concentrated in CMBS and corporate securities. These non-credit
impairments represent the difference between fair value and the Company’s best estimate of expected future cash flows discounted at the
security’s effective yield prior to impairment, rather than at current market implied credit spreads. These non-credit impairments
primarily represent increases in market liquidity premiums and credit spread widening that occurred after the securities were purchased,
as well as a discount for variable-rate coupons which are paying less than at purchase date. In general, larger liquidity premiums and
wider credit spreads are the result of deterioration of the underlying collateral performance of the securities, as well as the risk premium
required to reflect future uncertainty in the real estate market.