The Hartford 2013 Annual Report Download - page 200
Download and view the complete annual report
Please find page 200 of the 2013 The Hartford annual report below. You can navigate through the pages in the report by either clicking on the pages listed below, or by using the keyword search tool below to find specific information within the annual report.-
 1
1 -
2
-
3
-
4
-
5
-
6
-
7
-
8
-
9
-
10
-
11
-
12
-
13
-
14
-
15
-
16
-
17
-
18
-
19
-
20
-
21
-
22
-
23
-
24
-
25
-
26
-
27
-
28
-
29
-
30
-
31
-
32
-
33
-
34
-
35
-
36
-
37
-
38
-
39
-
40
-
41
-
42
-
43
-
44
-
45
-
46
-
47
-
48
-
49
-
50
-
51
-
52
-
53
-
54
-
55
-
56
-
57
-
58
-
59
-
60
-
61
-
62
-
63
-
64
-
65
-
66
-
67
-
68
-
69
-
70
-
71
-
72
-
73
-
74
-
75
-
76
-
77
-
78
-
79
-
80
-
81
-
82
-
83
-
84
-
85
-
86
-
87
-
88
-
89
-
90
-
91
-
92
-
93
-
94
-
95
-
96
-
97
-
98
-
99
-
100
-
101
-
102
-
103
-
104
-
105
-
106
-
107
-
108
-
109
-
110
-
111
-
112
-
113
-
114
-
115
-
116
-
117
-
118
-
119
-
120
-
121
-
122
-
123
-
124
-
125
-
126
-
127
-
128
-
129
-
130
-
131
-
132
-
133
-
134
-
135
-
136
-
137
-
138
-
139
-
140
-
141
-
142
-
143
-
144
-
145
-
146
-
147
-
148
-
149
-
150
-
151
-
152
-
153
-
154
-
155
-
156
-
157
-
158
-
159
-
160
-
161
-
162
-
163
-
164
-
165
-
166
-
167
-
168
-
169
-
170
-
171
-
172
-
173
-
174
-
175
-
176
-
177
-
178
-
179
-
180
-
181
-
182
-
183
-
184
-
185
-
186
-
187
-
188
-
189
-
 190
190 -
 191
191 -
 192
192 -
 193
193 -
 194
194 -
 195
195 -
 196
196 -
 197
197 -
 198
198 -
 199
199 -
 200
200 -
 201
201 -
 202
202 -
 203
203 -
 204
204 -
 205
205 -
 206
206 -
 207
207 -
 208
208 -
 209
209 -
 210
210 -
211
-
212
-
213
-
214
-
215
-
216
-
217
-
218
-
219
-
220
-
221
-
222
-
223
-
224
-
225
-
226
-
227
-
228
-
229
-
230
-
231
-
232
-
233
-
234
-
235
-
236
-
237
-
238
-
239
-
240
-
241
-
242
-
243
-
244
-
245
-
246
-
247
-
248
-
249
-
250
 |
 |

F-64
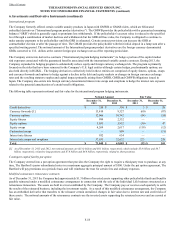
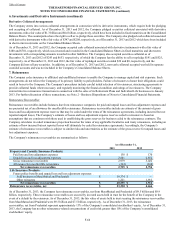
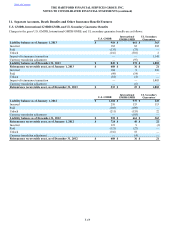
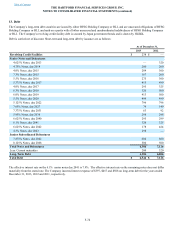
Derivative Collateral Arrangements
The Company enters into various collateral arrangements in connection with its derivative instruments, which require both the pledging
and accepting of collateral. As of December 31, 2013 and 2012, the Company pledged securities collateral associated with derivative
instruments with a fair value of $1.3 billion and $0.6 billion, respectively, which have been included in fixed maturities on the Consolidated
Balance Sheets. The counterparties have the right to sell or re-pledge these securities. The Company also pledged cash collateral associated
with derivative instruments with a fair value of $347 and $208, respectively, as of December 31, 2013 and 2012 which have been included
in short-term investments on the Consolidated Balance Sheets.
As of December 31, 2013 and 2012, the Company accepted cash collateral associated with derivative instruments with a fair value of
$180 and $701, respectively, which was invested and recorded in the Consolidated Balance Sheets in fixed maturities and short-term
investments with corresponding amounts recorded in other liabilities. The Company also accepted securities collateral as of
December 31, 2013 and 2012 of $243 and $653, respectively, of which the Company has the ability to sell or repledge $191 and $525,
respectively. As of December 31, 2013 and 2012, the fair value of repledged securities totaled $39 and $0, respectively, and the
Company did not sell any securities. In addition, as of December 31, 2013 and 2012, non-cash collateral accepted was held in separate
custodial accounts and was not included in the Company’s Consolidated Balance Sheets.
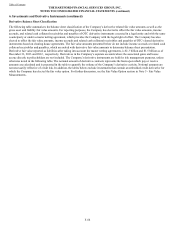
7. Reinsurance
The Company cedes insurance to affiliated and unaffiliated insurers to enable the Company to manage capital and risk exposure. Such
arrangements do not relieve the Company of its primary liability to policyholders. Failure of reinsurers to honor their obligations could
result in losses to the Company. The Company's procedures include careful initial selection of its reinsurers, structuring agreements to
provide collateral funds where necessary, and regularly monitoring the financial condition and ratings of its reinsurers. The Company
entered into two reinsurance transactions in connection with the sales of its Retirement Plans and Individual Life businesses in January
2013. For further discussion of these transactions, see Note 2 - Business Dispositions of Notes to Consolidated Financial Statements.
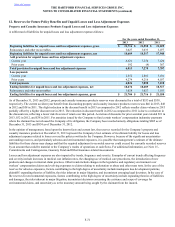
Reinsurance Recoverables
Reinsurance recoverables include balances due from reinsurance companies for paid and unpaid losses and loss adjustment expenses and
are presented net of an allowance for uncollectible reinsurance. Reinsurance recoverables include an estimate of the amount of gross
losses and loss adjustment expense reserves that may be ceded under the terms of the reinsurance agreements, including incurred but not
reported unpaid losses. The Company’s estimate of losses and loss adjustment expense reserves ceded to reinsurers is based on
assumptions that are consistent with those used in establishing the gross reserves for business ceded to the reinsurance contracts. The
Company calculates its ceded reinsurance projection based on the terms of any applicable facultative and treaty reinsurance, including an
estimate of how incurred but not reported losses will ultimately be ceded by reinsurance agreements. Accordingly, the Company’s
estimate of reinsurance recoverables is subject to similar risks and uncertainties as the estimate of the gross reserve for unpaid losses and
loss adjustment expenses.
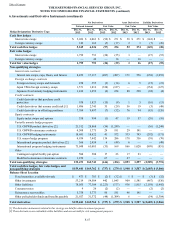
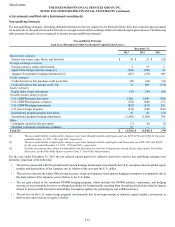
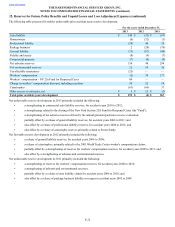
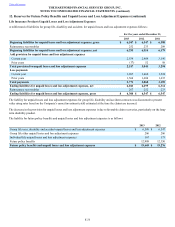
The Company's reinsurance recoverables are summarized as follows:
As of December 31,
2013 2012
Property and Casualty Insurance Products:
Paid loss and loss adjustment expenses $ 138 $ 170
Unpaid loss and loss adjustment expenses 2,841 2,852
Gross reinsurance recoverable 2,979 3,022
Allowance for uncollectible reinsurance (244) (268)
Net reinsurance recoverables $ 2,735 $ 2,754
Life Insurance Products:
Future policy benefits and unpaid loss and loss adjustment expenses:
Sold businesses (MassMutual and Prudential) $ 19,374 $ —
Other reinsurers 1,221 1,912
Net reinsurance recoverables $ 20,595 $ 1,912
Reinsurance recoverables, net $ 23,330 $ 4,666
As of December 31, 2013, the Company has reinsurance recoverables, net from MassMutual and Prudential of $9.5 billion and $9.9
billion, respectively. These reinsurance recoverables are secured by invested assets held in trust for the benefit of the Company in the
event of a default by the reinsurers. As of December 31, 2013, the fair value of assets held in trust securing the reinsurance recoverables
from MassMutual and Prudential were $9.5 billion and $7.5 billion, respectively. As of December 31, 2013, the reinsurance
recoverables, net from Prudential represent approximately 13% of the Company's consolidated stockholders' equity. As of December 31,
2013, the Company has no other reinsurance-related concentrations of credit risk greater than 10% of the Company’s consolidated
stockholders’ equity.
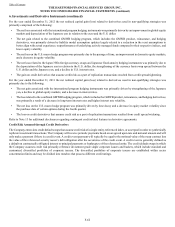
Table of Contents THE HARTFORD FINANCIAL SERVICES GROUP, INC.
NOTES TO CONSOLIDATED FINANCIAL STATEMENTS (continued)
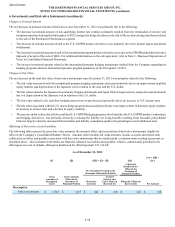
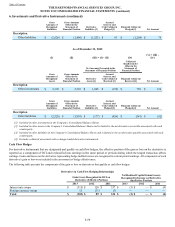
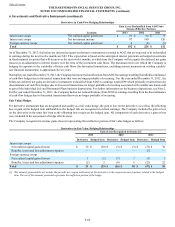
6. Investments and Derivative Instruments (continued)