The Hartford 2013 Annual Report Download - page 182
Download and view the complete annual report
Please find page 182 of the 2013 The Hartford annual report below. You can navigate through the pages in the report by either clicking on the pages listed below, or by using the keyword search tool below to find specific information within the annual report.-
 1
1 -
2
-
3
-
4
-
5
-
6
-
7
-
8
-
9
-
10
-
11
-
12
-
13
-
14
-
15
-
16
-
17
-
18
-
19
-
20
-
21
-
22
-
23
-
24
-
25
-
26
-
27
-
28
-
29
-
30
-
31
-
32
-
33
-
34
-
35
-
36
-
37
-
38
-
39
-
40
-
41
-
42
-
43
-
44
-
45
-
46
-
47
-
48
-
49
-
50
-
51
-
52
-
53
-
54
-
55
-
56
-
57
-
58
-
59
-
60
-
61
-
62
-
63
-
64
-
65
-
66
-
67
-
68
-
69
-
70
-
71
-
72
-
73
-
74
-
75
-
76
-
77
-
78
-
79
-
80
-
81
-
82
-
83
-
84
-
85
-
86
-
87
-
88
-
89
-
90
-
91
-
92
-
93
-
94
-
95
-
96
-
97
-
98
-
99
-
100
-
101
-
102
-
103
-
104
-
105
-
106
-
107
-
108
-
109
-
110
-
111
-
112
-
113
-
114
-
115
-
116
-
117
-
118
-
119
-
120
-
121
-
122
-
123
-
124
-
125
-
126
-
127
-
128
-
129
-
130
-
131
-
132
-
133
-
134
-
135
-
136
-
137
-
138
-
139
-
140
-
141
-
142
-
143
-
144
-
145
-
146
-
147
-
148
-
149
-
150
-
151
-
152
-
153
-
154
-
155
-
156
-
157
-
158
-
159
-
160
-
161
-
162
-
163
-
164
-
165
-
166
-
167
-
168
-
169
-
170
-
171
-
 172
172 -
 173
173 -
 174
174 -
 175
175 -
 176
176 -
 177
177 -
 178
178 -
 179
179 -
 180
180 -
 181
181 -
 182
182 -
 183
183 -
 184
184 -
 185
185 -
 186
186 -
 187
187 -
 188
188 -
 189
189 -
 190
190 -
 191
191 -
 192
192 -
193
-
194
-
195
-
196
-
197
-
198
-
199
-
200
-
201
-
202
-
203
-
204
-
205
-
206
-
207
-
208
-
209
-
210
-
211
-
212
-
213
-
214
-
215
-
216
-
217
-
218
-
219
-
220
-
221
-
222
-
223
-
224
-
225
-
226
-
227
-
228
-
229
-
230
-
231
-
232
-
233
-
234
-
235
-
236
-
237
-
238
-
239
-
240
-
241
-
242
-
243
-
244
-
245
-
246
-
247
-
248
-
249
-
250
 |
 |

F-46
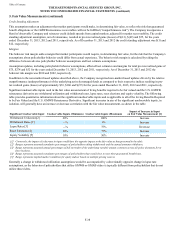
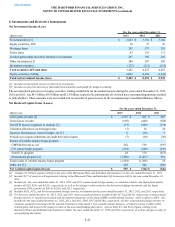
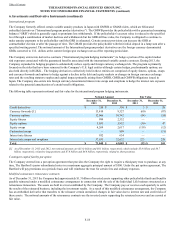
Net realized capital gains and losses from investment sales are reported as a component of revenues and are determined on a specific
identification basis. Gross gains and losses on sales and impairments previously reported as unrealized gains or (losses) in AOCI were
$1.6 billion, $32 and $129 for the years ended December 31, 2013, 2012 and 2011, respectively.
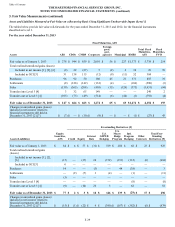
Sales of Available-for-Sale Securities
For the years ended December 31,
2013 2012 2011
Fixed maturities, AFS
Sale proceeds $ 39,225 $ 41,442 $ 36,956
Gross gains [1] 2,214 845 617
Gross losses (669)(416) (381)
Equity securities, AFS
Sale proceeds $ 274 $ 295 $ 239
Gross gains 96 34 59
Gross losses (6)(20) —
[1] Includes $1.5 billion of gross gains related to the sale of the Individual Life and Retirement Plans businesses for the year ended December 31, 2013.
Sales of AFS securities in 2013 were primarily as a result of management of duration and liquidity as well as progress towards sector
allocation objectives.
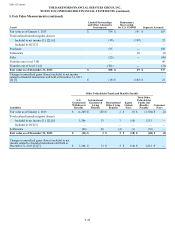
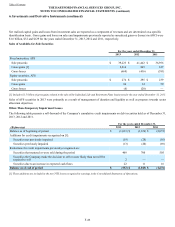
Other-Than-Temporary Impairment Losses
The following table presents a roll-forward of the Company’s cumulative credit impairments on debt securities held as of December 31,
2013, 2012 and 2011.
For the years ended December 31,
(Before-tax) 2013 2012 2011
Balance as of beginning of period $ (1,013) $ (1,676) $ (2,072)
Additions for credit impairments recognized on [1]:
Securities not previously impaired (19)(28) (56)
Securities previously impaired (13)(20) (69)
Reductions for credit impairments previously recognized on:
Securities that matured or were sold during the period 469 700 505
Securities the Company made the decision to sell or more likely than not will be
required to sell 2 — —
Securities due to an increase in expected cash flows 22 11 16
Balance as of end of period $ (552) $ (1,013) $ (1,676)
[1] These additions are included in the net OTTI losses recognized in earnings in the Consolidated Statements of Operations.
Table of Contents THE HARTFORD FINANCIAL SERVICES GROUP, INC.
NOTES TO CONSOLIDATED FINANCIAL STATEMENTS (continued)
6. Investments and Derivative Instruments (continued)