The Hartford 2013 Annual Report Download - page 226
Download and view the complete annual report
Please find page 226 of the 2013 The Hartford annual report below. You can navigate through the pages in the report by either clicking on the pages listed below, or by using the keyword search tool below to find specific information within the annual report.-
 1
1 -
2
-
3
-
4
-
5
-
6
-
7
-
8
-
9
-
10
-
11
-
12
-
13
-
14
-
15
-
16
-
17
-
18
-
19
-
20
-
21
-
22
-
23
-
24
-
25
-
26
-
27
-
28
-
29
-
30
-
31
-
32
-
33
-
34
-
35
-
36
-
37
-
38
-
39
-
40
-
41
-
42
-
43
-
44
-
45
-
46
-
47
-
48
-
49
-
50
-
51
-
52
-
53
-
54
-
55
-
56
-
57
-
58
-
59
-
60
-
61
-
62
-
63
-
64
-
65
-
66
-
67
-
68
-
69
-
70
-
71
-
72
-
73
-
74
-
75
-
76
-
77
-
78
-
79
-
80
-
81
-
82
-
83
-
84
-
85
-
86
-
87
-
88
-
89
-
90
-
91
-
92
-
93
-
94
-
95
-
96
-
97
-
98
-
99
-
100
-
101
-
102
-
103
-
104
-
105
-
106
-
107
-
108
-
109
-
110
-
111
-
112
-
113
-
114
-
115
-
116
-
117
-
118
-
119
-
120
-
121
-
122
-
123
-
124
-
125
-
126
-
127
-
128
-
129
-
130
-
131
-
132
-
133
-
134
-
135
-
136
-
137
-
138
-
139
-
140
-
141
-
142
-
143
-
144
-
145
-
146
-
147
-
148
-
149
-
150
-
151
-
152
-
153
-
154
-
155
-
156
-
157
-
158
-
159
-
160
-
161
-
162
-
163
-
164
-
165
-
166
-
167
-
168
-
169
-
170
-
171
-
172
-
173
-
174
-
175
-
176
-
177
-
178
-
179
-
180
-
181
-
182
-
183
-
184
-
185
-
186
-
187
-
188
-
189
-
190
-
191
-
192
-
193
-
194
-
195
-
196
-
197
-
198
-
199
-
200
-
201
-
202
-
203
-
204
-
205
-
206
-
207
-
208
-
209
-
210
-
211
-
212
-
213
-
214
-
215
-
 216
216 -
 217
217 -
 218
218 -
 219
219 -
 220
220 -
 221
221 -
 222
222 -
 223
223 -
 224
224 -
 225
225 -
 226
226 -
 227
227 -
 228
228 -
 229
229 -
 230
230 -
 231
231 -
 232
232 -
 233
233 -
 234
234 -
 235
235 -
 236
236 -
237
-
238
-
239
-
240
-
241
-
242
-
243
-
244
-
245
-
246
-
247
-
248
-
249
-
250
 |
 |

F-90
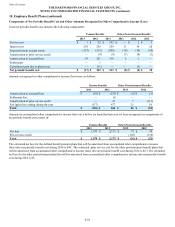
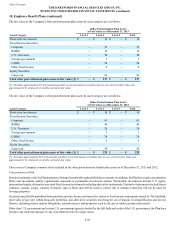
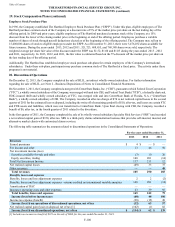
Other Postretirement
Pension Benefits Benefits
Change in Plan Assets 2013 2012 2013 2012
Fair value of plan assets — beginning of year $ 4,850 $ 4,513 $ 220 $ 203
Actual return on plan assets (27) 381 13 17
Employer contributions 101 201 — —
Benefits paid [1] (278)(230)(20) —
Expenses paid (15)(13) — —
Settlements — (3) — —
Foreign exchange adjustment (1) 1 — —
Fair value of plan assets — end of year $ 4,630 $ 4,850 $ 213 $ 220
Funded status — end of year $ (886) $ (1,230) $ (99) $ (93)
[1] In 2013 other postretirement benefits paid represent non-key employee postretirement medical benefits paid from the Company's prefunded trust
fund.
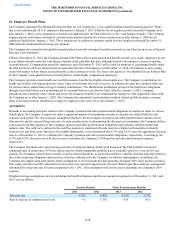
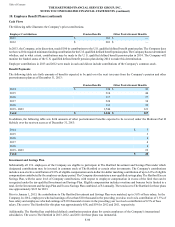
The fair value of assets for pension benefits, and hence the funded status, presented in the table above excludes assets of $123 and $116
held in rabbi trusts and designated for the non-qualified pension plans as of December 31, 2013 and 2012, respectively. The assets do not
qualify as plan assets; however, the assets are available to pay benefits for certain retired, terminated and active participants. Such assets
are available to the Company’s general creditors in the event of insolvency. The assets consist of equity and fixed income investments.
To the extent the fair value of these rabbi trusts were included in the table above, pension plan assets would have been $4,753 and
$4,966 as of December 31, 2013 and 2012, respectively, and the funded status of pension benefits would have been $(763) and $(1,114)
as of December 31, 2013 and 2012, respectively.
The accumulated benefit obligation for all defined benefit pension plans was $5,515 and $6,079 as of December 31, 2013 and 2012,
respectively.
The following table provides information for The Hartford’s defined benefit pension plans with an accumulated benefit obligation in
excess of plan assets.
As of December 31,
2013 2012
Projected benefit obligation $ 5,516 $ 6,080
Accumulated benefit obligation 5,515 6,079
Fair value of plan assets 4,630 4,850
Amounts recognized in the Consolidated Balance Sheets as of December 31 consist of:
Pension Benefits Other Postretirement Benefits
2013 2012 2013 2012
Other assets $ — $ — $ — $ —
Other liabilities 886 1,230 99 93
Total $ 886 $ 1,230 $ 99 $ 93
Table of Contents THE HARTFORD FINANCIAL SERVICES GROUP, INC.
NOTES TO CONSOLIDATED FINANCIAL STATEMENTS (continued)
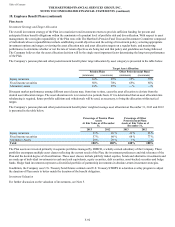
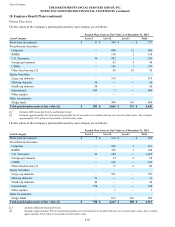
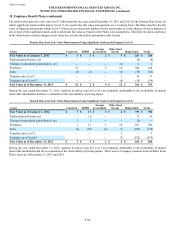
18. Employee Benefit Plans (continued)