The Hartford 2013 Annual Report Download - page 40
Download and view the complete annual report
Please find page 40 of the 2013 The Hartford annual report below. You can navigate through the pages in the report by either clicking on the pages listed below, or by using the keyword search tool below to find specific information within the annual report.-
 1
1 -
2
-
3
-
4
-
5
-
6
-
7
-
8
-
9
-
10
-
11
-
12
-
13
-
14
-
15
-
16
-
17
-
18
-
19
-
20
-
21
-
22
-
23
-
24
-
25
-
26
-
27
-
28
-
29
-
 30
30 -
 31
31 -
 32
32 -
 33
33 -
 34
34 -
 35
35 -
 36
36 -
 37
37 -
 38
38 -
 39
39 -
 40
40 -
 41
41 -
 42
42 -
 43
43 -
 44
44 -
 45
45 -
 46
46 -
 47
47 -
 48
48 -
 49
49 -
 50
50 -
51
-
52
-
53
-
54
-
55
-
56
-
57
-
58
-
59
-
60
-
61
-
62
-
63
-
64
-
65
-
66
-
67
-
68
-
69
-
70
-
71
-
72
-
73
-
74
-
75
-
76
-
77
-
78
-
79
-
80
-
81
-
82
-
83
-
84
-
85
-
86
-
87
-
88
-
89
-
90
-
91
-
92
-
93
-
94
-
95
-
96
-
97
-
98
-
99
-
100
-
101
-
102
-
103
-
104
-
105
-
106
-
107
-
108
-
109
-
110
-
111
-
112
-
113
-
114
-
115
-
116
-
117
-
118
-
119
-
120
-
121
-
122
-
123
-
124
-
125
-
126
-
127
-
128
-
129
-
130
-
131
-
132
-
133
-
134
-
135
-
136
-
137
-
138
-
139
-
140
-
141
-
142
-
143
-
144
-
145
-
146
-
147
-
148
-
149
-
150
-
151
-
152
-
153
-
154
-
155
-
156
-
157
-
158
-
159
-
160
-
161
-
162
-
163
-
164
-
165
-
166
-
167
-
168
-
169
-
170
-
171
-
172
-
173
-
174
-
175
-
176
-
177
-
178
-
179
-
180
-
181
-
182
-
183
-
184
-
185
-
186
-
187
-
188
-
189
-
190
-
191
-
192
-
193
-
194
-
195
-
196
-
197
-
198
-
199
-
200
-
201
-
202
-
203
-
204
-
205
-
206
-
207
-
208
-
209
-
210
-
211
-
212
-
213
-
214
-
215
-
216
-
217
-
218
-
219
-
220
-
221
-
222
-
223
-
224
-
225
-
226
-
227
-
228
-
229
-
230
-
231
-
232
-
233
-
234
-
235
-
236
-
237
-
238
-
239
-
240
-
241
-
242
-
243
-
244
-
245
-
246
-
247
-
248
-
249
-
250
 |
 |
40
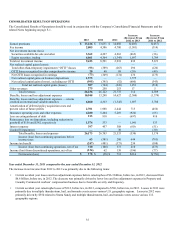
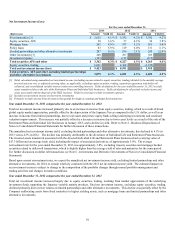
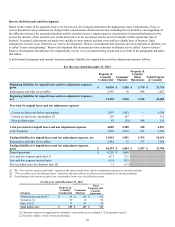
Net Realized Capital Gains (Losses)
For the years ended December 31,
(Before tax) 2013 2012 2011
Gross gains on sales $ 2,387 $ 821 $ 687
Gross losses on sales (692)(440) (384)
Net OTTI losses recognized in earnings [1] (73)(349) (174)
Valuation allowances on mortgage loans (1) 14 24
Japanese fixed annuity contract hedges, net [2] 6 (36) 3
Periodic net coupon settlements on credit derivatives/Japan (7)(10) (10)
Results of variable annuity hedge program
U.S. GMWB derivatives, net 262 519 (397)
U.S. macro hedge program (234)(340) (216)
Total U.S. program 28 179 (613)
International program (1,586)(1,467) 691
Total results of variable annuity hedge program (1,558)(1,288) 78
Other, net [3] 445 544 (450)
Net realized capital gains (losses) $ 507 $ (744) $ (226)
[1] Includes $177 of intent-to-sell impairments for the year ended December 31, 2012, relating to the sales of the Retirement Plans and Individual Life
businesses in 2013.
[2] Relates to the Japanese fixed annuity products (adjustment of product liability for changes in spot currency exchange rates, related derivative
hedging instruments excluding periodic net coupon settlements, and the change in value related to Japan government FVO securities).
[3] Primarily consists of transactional foreign currency re-valuation associated with the internal reinsurance of the Japan variable annuity business,
which is primarily offset in AOCI, and gains and losses on non-qualifying derivatives.
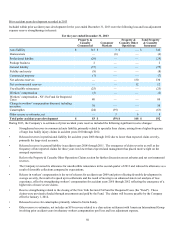
Details on the Company’s net realized capital gains and losses are as follows:
Gross gains and losses on sales
• Gross gains on sales for the year ended December 31, 2013 were predominately from the sale of the Retirement Plans and
Individual Life businesses resulting in a gain of $1.5 billion. The remaining gains on sales were primarily due to the sales of
corporate securities and tax-exempt municipals. Gross losses on sales were primarily the result of the sales of U.S. Treasuries and
mortgage backed securities. The sales were predominantly due to management of duration and liquidity as well as progress towards
sector allocation objectives.
• Gross gains and losses on sales for the year ended December 31, 2012 were predominately from investment grade corporate
securities, municipal bonds, mortgage backed securities and U.S. Treasuries. These sales were the result of tactical portfolio
management as well as to maintain duration targets.
• Gross gains and losses on sales for the year ended December 31, 2011 were predominately from investment grade corporate
securities, U.S. Treasuries, municipal bonds and commercial real estate related securities. These sales were the result of
reinvestment into spread product well-positioned for modest economic growth, as well as the purposeful reduction of certain
exposures.
Net OTTI losses
• See Other-Than-Temporary Impairments within the Investment Portfolio Risks and Risk Management section of the MD&A.
Valuation allowances on mortgage loans
• See Valuation Allowances on Mortgage Loans within the Investment Portfolio Risks and Risk Management section of the MD&A.