The Hartford 2013 Annual Report Download - page 188
Download and view the complete annual report
Please find page 188 of the 2013 The Hartford annual report below. You can navigate through the pages in the report by either clicking on the pages listed below, or by using the keyword search tool below to find specific information within the annual report.-
 1
1 -
2
-
3
-
4
-
5
-
6
-
7
-
8
-
9
-
10
-
11
-
12
-
13
-
14
-
15
-
16
-
17
-
18
-
19
-
20
-
21
-
22
-
23
-
24
-
25
-
26
-
27
-
28
-
29
-
30
-
31
-
32
-
33
-
34
-
35
-
36
-
37
-
38
-
39
-
40
-
41
-
42
-
43
-
44
-
45
-
46
-
47
-
48
-
49
-
50
-
51
-
52
-
53
-
54
-
55
-
56
-
57
-
58
-
59
-
60
-
61
-
62
-
63
-
64
-
65
-
66
-
67
-
68
-
69
-
70
-
71
-
72
-
73
-
74
-
75
-
76
-
77
-
78
-
79
-
80
-
81
-
82
-
83
-
84
-
85
-
86
-
87
-
88
-
89
-
90
-
91
-
92
-
93
-
94
-
95
-
96
-
97
-
98
-
99
-
100
-
101
-
102
-
103
-
104
-
105
-
106
-
107
-
108
-
109
-
110
-
111
-
112
-
113
-
114
-
115
-
116
-
117
-
118
-
119
-
120
-
121
-
122
-
123
-
124
-
125
-
126
-
127
-
128
-
129
-
130
-
131
-
132
-
133
-
134
-
135
-
136
-
137
-
138
-
139
-
140
-
141
-
142
-
143
-
144
-
145
-
146
-
147
-
148
-
149
-
150
-
151
-
152
-
153
-
154
-
155
-
156
-
157
-
158
-
159
-
160
-
161
-
162
-
163
-
164
-
165
-
166
-
167
-
168
-
169
-
170
-
171
-
172
-
173
-
174
-
175
-
176
-
177
-
 178
178 -
 179
179 -
 180
180 -
 181
181 -
 182
182 -
 183
183 -
 184
184 -
 185
185 -
 186
186 -
 187
187 -
 188
188 -
 189
189 -
 190
190 -
 191
191 -
 192
192 -
 193
193 -
 194
194 -
 195
195 -
 196
196 -
 197
197 -
 198
198 -
199
-
200
-
201
-
202
-
203
-
204
-
205
-
206
-
207
-
208
-
209
-
210
-
211
-
212
-
213
-
214
-
215
-
216
-
217
-
218
-
219
-
220
-
221
-
222
-
223
-
224
-
225
-
226
-
227
-
228
-
229
-
230
-
231
-
232
-
233
-
234
-
235
-
236
-
237
-
238
-
239
-
240
-
241
-
242
-
243
-
244
-
245
-
246
-
247
-
248
-
249
-
250
 |
 |

F-52
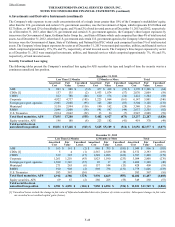
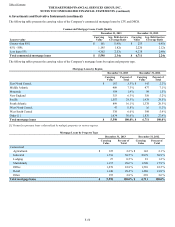
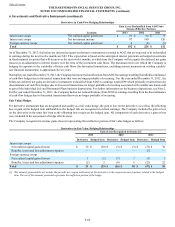
Repurchase and Dollar Roll Agreements and Other Collateral Transactions
The Company enters into repurchase agreements and dollar roll transactions to manage liquidity or to earn incremental spread income. A
repurchase agreement is a transaction in which one party (transferor) agrees to sell securities to another party (transferee) in return for cash
(or securities), with a simultaneous agreement to repurchase the same securities at a specified price at a later date. A dollar roll is a type of
repurchase agreement where a mortgage backed security is sold with an agreement to repurchase substantially the same security at a specified
time in the future. These transactions are generally short-term in nature, and therefore, the carrying amounts of these instruments approximate
fair value.
As part of repurchase agreements and dollar roll transactions, the Company transfers collateral of U.S. government and government
agency securities and receives cash. For the repurchase agreements, the Company obtains cash in an amount equal to at least 95% of the
fair value of the securities transferred. The agreements contain contractual provisions that require additional collateral to be transferred
when necessary and provide the counterparty the right to sell or re-pledge the securities transferred. The cash received from the
repurchase program is typically invested in short-term investments or fixed maturities. Repurchase agreements include master netting
provisions that provide the counterparties the right to set off claims and apply securities held by them in respect of their obligations in
the event of a default. The Company accounts for the repurchase agreements and dollar roll transactions as collateralized borrowings.
The securities transferred under repurchase agreements and dollar roll transactions are included in fixed maturities, AFS with the
obligation to repurchase those securities recorded in other liabilities on the Company's Consolidated Balance Sheets.
As of December 31, 2013, the Company has no outstanding repurchase agreements or dollar roll transactions. As of December 31, 2012,
the Company reported financial collateral pledged relating to repurchase agreements of $923 in fixed maturities, AFS on the Consolidated
Balance sheets. The Company reported a corresponding obligation to repurchase these securities of $923 in other liabilities on the
Consolidated Balance sheets. With respect to dollar roll transactions, the Company reported financial collateral pledged with a fair value
of $1.0 billion in fixed maturities, AFS with a corresponding obligation to repurchase $1.0 billion reported in other liabilities, as of
December 31, 2012.
The Company is required by law to deposit securities with government agencies in states where it conducts business. As of
December 31, 2013 and 2012 the fair value of securities on deposit was approximately $1.9 billion and $1.7 billion, respectively.
As of December 31, 2013, the Company has pledged as collateral $272 in Japan government bonds reported in fixed maturities, AFS,
associated with short-term debt of $238.
As of December 31, 2013 and 2012, the Company has pledged as collateral $34 and $59, respectively, of U.S. government securities and
government agency securities for letters of credit.
Refer to Derivative Collateral Arrangements section of this note for disclosure of collateral in support of derivative transactions.
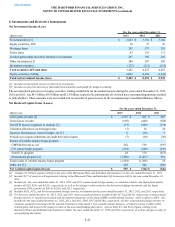
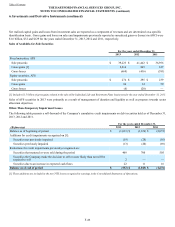
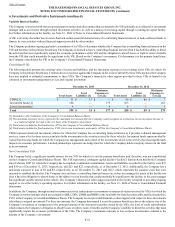
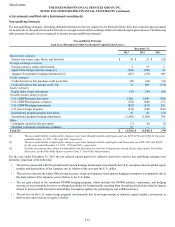
Equity Method Investments
The majority of the Company's investments in limited partnerships and other alternative investments, including hedge funds, mortgage
and real estate funds, mezzanine debt funds, and private equity and other funds (collectively, “limited partnerships”), are accounted for
under the equity method of accounting. The Company’s maximum exposure to loss as of December 31, 2013 is limited to the total
carrying value of $2.1 billion. In addition, the Company has outstanding commitments totaling $531 to fund limited partnership and
other alternative investments as of December 31, 2013. The Company’s investments in limited partnerships are generally of a passive
nature in that the Company does not take an active role in the management of the limited partnerships. In 2013, aggregate investment
income from limited partnerships and other alternative investments exceeded 10% of the Company’s pre-tax consolidated net income.
Accordingly, the Company is disclosing aggregated summarized financial data for the Company’s limited partnership investments. This
aggregated summarized financial data does not represent the Company’s proportionate share of limited partnership assets or earnings.
Aggregate total assets of the limited partnerships in which the Company invested totaled $85.6 billion and $90.5 billion as of
December 31, 2013 and 2012, respectively. Aggregate total liabilities of the limited partnerships in which the Company invested totaled
$11.4 billion and $12.8 billion as of December 31, 2013 and 2012, respectively. Aggregate net investment income of the limited
partnerships in which the Company invested totaled $1.8 billion, $1.0 billion and $1.3 billion for the periods ended December 31, 2013,
2012 and 2011, respectively. Aggregate net income of the limited partnerships in which the Company invested totaled $8.4 billion, $7.2
billion and $9.1 billion for the periods ended December 31, 2013, 2012 and 2011, respectively. As of, and for the period ended,
December 31, 2013, the aggregated summarized financial data reflects the latest available financial information.
Table of Contents THE HARTFORD FINANCIAL SERVICES GROUP, INC.
NOTES TO CONSOLIDATED FINANCIAL STATEMENTS (continued)
6. Investments and Derivative Instruments (continued)